Interpréter les graphiques d’autocorrélation
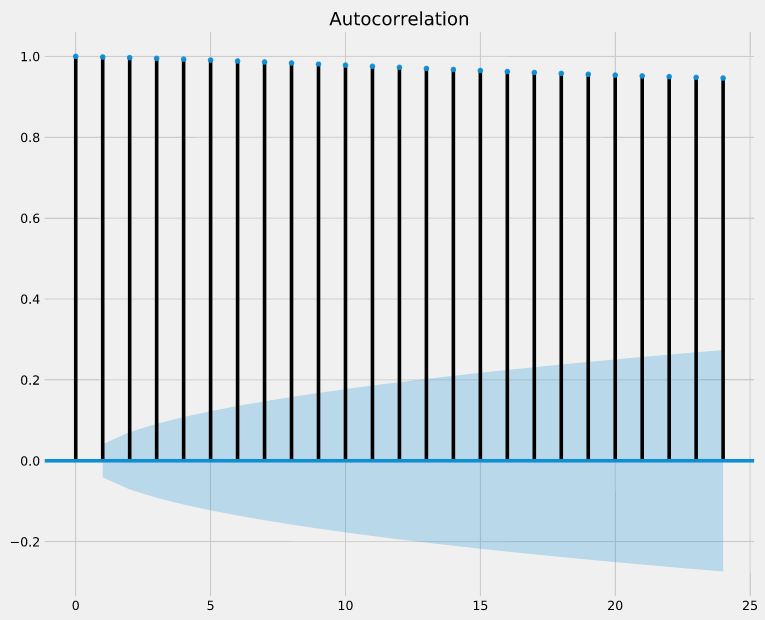
Si les valeurs d’autocorrélation sont proches de 0, alors les valeurs entre observations consécutives ne sont pas corrélées entre elles. À l’inverse, des autocorrélations proches de 1 ou de -1 indiquent l’existence de fortes corrélations positives ou négatives entre observations consécutives, respectivement.
Pour vous aider à évaluer la fiabilité de ces valeurs d’autocorrélation, la fonction plot_acf() renvoie également des intervalles de confiance (représentés par des zones bleues ombrées). Si une valeur d’autocorrélation dépasse la zone d’intervalle de confiance, vous pouvez considérer que l’autocorrélation observée est statistiquement significative.
Dans le graphique d’autocorrélation ci-dessous, les observations consécutives sont-elles fortement corrélées (c.-à-d. supérieures à 0,5) et statistiquement significatives ?
Cet exercice fait partie du cours
<cours>Visualiser des séries temporelles en Python</cours>Exercice interactif pratique
Transformez la théorie en action avec l’un de nos exercices interactifs
 Commencer l’exercice