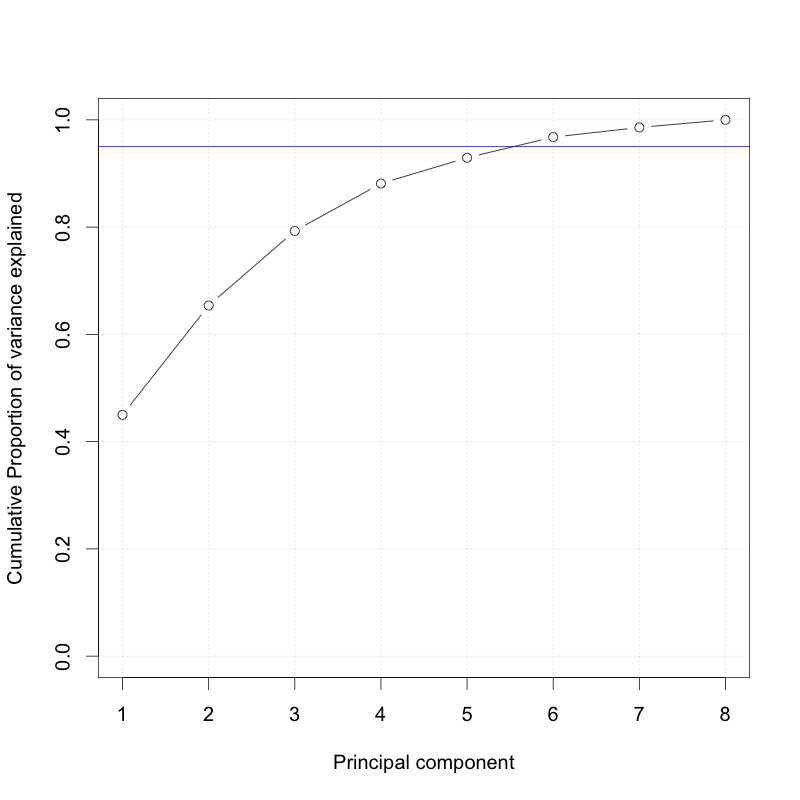
Nombre de composantes expliquant 95 % de la variation
D'après le graphique de l'exercice précédent, reproduit ci-dessous, combien de composantes sont nécessaires pour expliquer 95 % de la variation des données ?
Cet exercice fait partie du cours
<cours>Lois de probabilité multivariées en R</cours>Exercice interactif pratique
Transformez la théorie en action avec l’un de nos exercices interactifs
 Commencer l’exercice