Extrapolation : franchir la limite
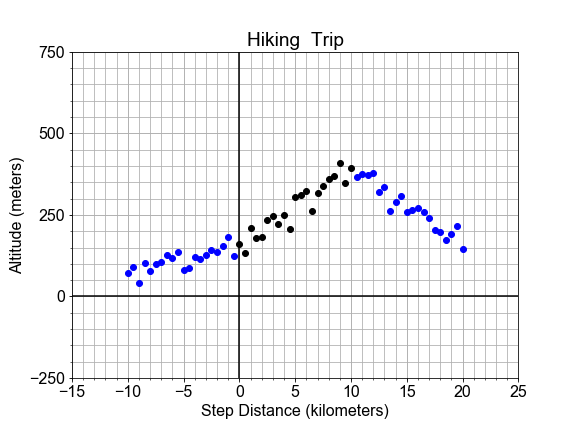
Dans cet exercice, nous abordons les dangers de l’extrapolation. Voici le profil d’un sentier de randonnée en montagne. Une portion du sentier, indiquée en noir, semble linéaire et a servi à construire un modèle. Mais on voit que la droite de meilleur ajustement, en rouge, ne convient pas en dehors du « domaine » d’origine, car elle s’étend vers de nouvelles données externes, en bleu.
Si nous souhaitons utiliser le modèle pour prédire l’altitude tout en restant précis dans une certaine tolérance, quelles sont les plus petites et les plus grandes valeurs de la variable indépendante x auxquelles nous pouvons nous autoriser à appliquer le modèle ?
Ici, utilisez les objets préchargés x_data, y_data, y_model et plot_data_model_tolerance() pour réaliser votre solution.
Cet exercice fait partie du cours
<cours>Introduction à la modélisation linéaire en Python</cours>Instructions de l’exercice
- Utilisez
np.abs()pour calculer les résidus comme les différencesy_data - y_model. - Trouvez les valeurs
.min()et.max()dexpour lesquelles lesresidualssont inférieurs à unetolerance = 100mètres. - Utilisez
np.min()etnp.max()pour afficher l’intervalle (les plus grande et plus petite valeurs) dex_good. - Utilisez la fonction prédéfinie
plot_data_model_tolerance()pour comparer les données, le modèle et l’intervalle de valeursx_goodoùresiduals < tolerancevautTrue.
Exercice interactif pratique
Essayez cet exercice en complétant ce code d’exemple.
# Compute the residuals, "data - model", and determine where [residuals < tolerance]
residuals = np.abs(____ - ____)
tolerance = 100
x_good = x_data[____ < ____]

# Find the min and max of the "good" values, and plot y_data, y_model, and the tolerance range
print('Minimum good x value = {}'.format(np.____(____)))
print('Maximum good x value = {}'.format(np.____(____)))
fig = plot_data_model_tolerance(x_data, y_data, y_model, tolerance)