Tracer le modèle sur les données
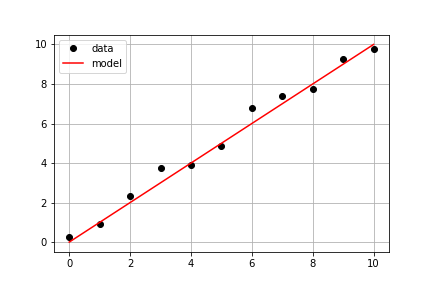
En reprenant les mêmes mesures que dans l’exercice précédent, votre objectif est d’utiliser une fonction model() prédéfinie ainsi que les données mesurées times et measured_distances pour calculer les distances modélisées, puis de tracer sur le même axe les données mesurées et modélisées.
Cet exercice fait partie du cours
<cours>Introduction à la modélisation linéaire en Python</cours>Instructions de l’exercice
- Utilisez
model_distances = model(times, measured_distances)pour calculer les valeurs modélisées. - Utilisez
plt.subplots()pour créer les objets figure et axe. - Utilisez
axis.plot()pour tracertimesvsmeasured_distancesavec les optionslinestyle=" ", marker="o", color="black". - Utilisez également
axis.plot()pour tracertimesvsmodel_distancesavec les optionslinestyle="-", color="red".
Exercice interactif pratique
Essayez cet exercice en complétant ce code d’exemple.
# Pass times and measured distances into model
model_distances = model(____, ____)

# Create figure and axis objects and call axis.plot() twice to plot data and model distances versus times
fig, axis = plt.subplots()
axis.plot(____, ____, linestyle="____", marker="____", color="____", label="Measured")
axis.plot(____, ____, linestyle="____", marker=None, color="____", label="Modeled")

# Add grid lines and a legend to your plot, and then show to display
axis.grid(True)
axis.legend(loc="best")
plt.show()