Tracer les données
En Python, tout est objet, même les modules. Votre objectif dans cet exercice est de revoir l’interface orientée objet de la bibliothèque Python matplotlib afin de visualiser des mesures avec un flux de travail plus flexible et extensible. Le flux de travail général pour tracer ressemble à ceci :
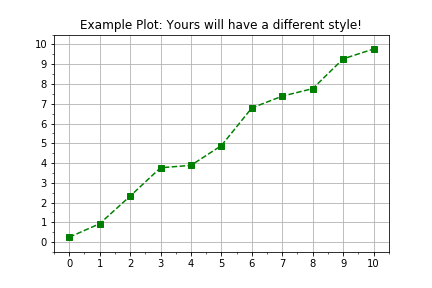
import matplotlib.pyplot as plt
fig, axis = plt.subplots()
axis.plot(x, y, color="green", linestyle="--", marker="s")
plt.show()
Cet exercice fait partie du cours
<cours>Introduction à la modélisation linéaire en Python</cours>Instructions de l’exercice
- Utilisez
plt.subplots()pour créer les objets figure et axis. - Les données sont fournies dans deux tableaux
numpyprédéfinis,timesetdistances. - Utilisez
axis.plot()pour tracertimesen abscisse etdistancesen ordonnée. - Utilisez les arguments nommés d’entrée
linestyle=" ",marker="o"etcolor="red"lors de l’appel àaxis.plot().
Exercice interactif pratique
Essayez cet exercice en complétant ce code d’exemple.
# Create figure and axis objects using subplots()
fig, axis = plt.____()

# Plot line using the axis.plot() method
line = axis.plot(____ , ____ , linestyle="____", marker="____", color="____")

# Use the plt.show() method to display the figure
plt.____()