Interpolation : entre deux dates
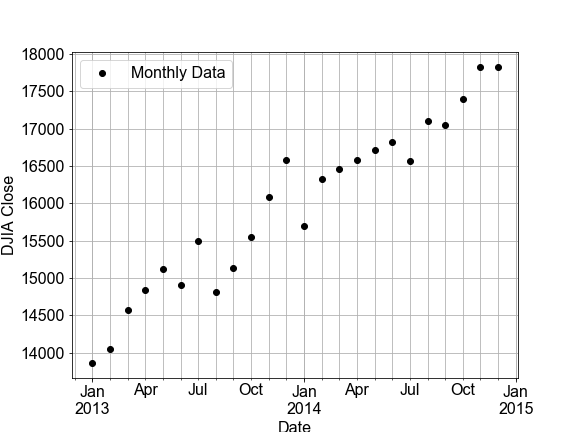
Dans cet exercice, vous allez construire un modèle linéaire en ajustant des données mensuelles en série temporelle pour le Dow Jones Industrial Average (DJIA), puis utiliser ce modèle pour faire des prédictions sur des données quotidiennes (autrement dit, une interpolation). Vous comparerez ensuite cette prédiction quotidienne aux vraies données quotidiennes du DJIA.
Quelques précisions sur les données. « OHLC » signifie « Open-High-Low-Close » (ouverture, plus haut, plus bas, clôture), généralement des données quotidiennes ; par exemple, les prix d’ouverture et de clôture, et les prix le plus haut et le plus bas d’une action au cours d’une journée. « DayCount » est un entier représentant le nombre de jours écoulés depuis le début de la collecte des données.
Cet exercice fait partie du cours
<cours>Introduction à la modélisation linéaire en Python</cours>Instructions de l’exercice
- Utilisez
ols()pour.fit()un modèle avecdata=df_monthlyetformula="Close ~ DayCount". - Utilisez
model_fit.predict()surdf_monthly.DayCountetdf_daily.DayCountafin de prédire les valeurs des prix de clôture mensuels et quotidiens, à stocker dans une nouvelle colonneModelde chaque DataFrame. - Utilisez la fonction prédéfinie
plot_model_with_datadeux fois, surdf_monthlypuis surdf_daily, et comparez les valeurs de RSS affichées.
Exercice interactif pratique
Essayez cet exercice en complétant ce code d’exemple.
# build and fit a model to the df_monthly data
model_fit = ols('Close ~ DayCount', ____=df_monthly).____()

# Use the model FIT to the MONTHLY data to make a predictions for both monthly and daily data
df_monthly['Model'] = model_fit.____(df_monthly.____)
df_daily['Model'] = model_fit.____(df_daily.____)

# Plot the monthly and daily data and model, compare the RSS values seen on the figures
fig_monthly = plot_model_with_data(____)
fig_daily = plot_model_with_data(____)