Pente et taux de variation
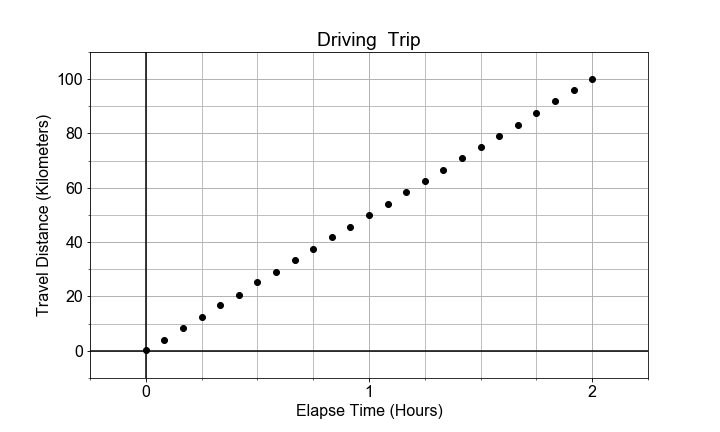
Dans cet exercice, vous allez modéliser le mouvement d’une voiture roulant à vitesse (approximativement) constante en calculant la vitesse moyenne sur l’ensemble du trajet. La relation linéaire modélisée est celle entre le temps écoulé et la distance parcourue.
Dans ce contexte, le paramètre du modèle a1, ou la pente, est approximé, autrement dit « estimé », par la vitesse moyenne, c’est-à-dire le « taux de variation » de la distance (« rise ») divisé par le temps (« run »).
Cet exercice fait partie du cours
<cours>Introduction à la modélisation linéaire en Python</cours>Instructions de l’exercice
- Calculez les différences point à point de
timeset dedistancesavecnumpy.diff(). - Calculez un tableau de
velocitiescomme le rapport dediff_distancedivisé pardiff_times. - Calculez la moyenne et l’étendue des valeurs de vitesse, en utilisant les méthodes
numpymean,max,min. - Tracez le tableau
velocitiespour visualiser la moyenne et la dispersion des valeurs.
Exercice interactif pratique
Essayez cet exercice en complétant ce code d’exemple.
# Compute an array of velocities as the slope between each point
diff_distances = np.diff(____)
diff_times = np.diff(____)
velocities = ____ / diff_times

# Chracterize the center and spread of the velocities
v_avg = np.____(velocities)
v_max = np.____(velocities)
v_min = np.____(velocities)
v_range = ____ - ____

# Plot the distribution of velocities
fig = plot_velocity_timeseries(times[1:], velocities)