Estimation de la vitesse et de la confiance
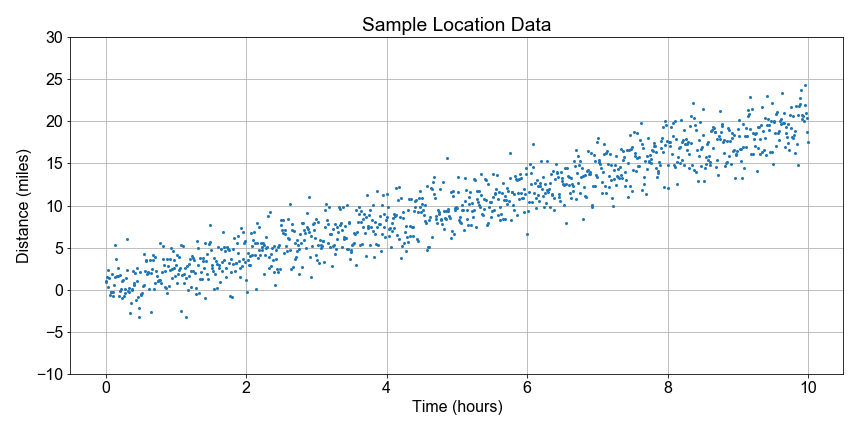
Continuons avec les données de randonnée du parc national. Remarquez que certaines distances sont négatives, car la marche s’est faite dans le sens opposé au départ du sentier ; les données sont imparfaites, donc concentrons-nous sur la tendance générale.
Dans cet exercice, votre objectif est d’utiliser le bootstrap (rééchantillonnage) pour obtenir la distribution des valeurs de vitesse d’un modèle linéaire, puis, à partir de cette distribution, calculer la meilleure estimation de la vitesse ainsi que l’intervalle de confiance à 90 % de cette estimation. Ici, la vitesse correspond au paramètre de pente du modèle de régression linéaire qui ajuste la distance en fonction du temps.
Pour vous aider à démarrer, nous avons préchargé les données distance et time, ainsi qu’une fonction least_squares() pré-définie pour calculer la valeur de vitesse pour chaque rééchantillonnage.
Cet exercice fait partie du cours
<cours>Introduction à la modélisation linéaire en Python</cours>Instructions de l’exercice
- Utilisez
np.random.choice()pour tirersample_indsà partir depopulation_inds, en préservant l’association distance-temps de chaque donnée. - Pour préserver l’ordre temporel, appliquez
.sort()àsample_inds, puis utilisezsample_indspour indexerdistancesettimes. - Utilisez
least_squares(times, distances)pour calculer les paramètres du modèle linéaire et stockeza1dansresample_speeds. - Appliquez
np.mean()etnp.percentiles()àresample_speedspour calculer la vitesse et l’intervalle de confianceci_90, puis affichez les deux.
Exercice interactif pratique
Essayez cet exercice en complétant ce code d’exemple.
# Resample each preloaded population, and compute speed distribution
population_inds = np.arange(0, 99, dtype=int)
for nr in range(num_resamples):
    sample_inds = np.random.choice(____, size=100, replace=True)
    sample_inds.____()
    sample_distances = distances[____]
    sample_times = times[____]
    a0, a1 = ____(sample_times, sample_distances)
    resample_speeds[nr] = ____

# Compute effect size and confidence interval, and print
speed_estimate = np.mean(____)
ci_90 = np.percentile(____, [5, 95])
print('Speed Estimate = {:0.2f}, 90% Confidence Interval: {:0.2f}, {:0.2f} '.format(____, ____[0], ____[1]))