Covariance vs Corrélation
La covariance mesure si deux variables évoluent ("varient") ensemble. Elle se calcule en prenant, point par point, le produit des déviations vues dans l’exercice précédent, dx[n]*dy[n], puis en faisant la moyenne de tous ces produits.
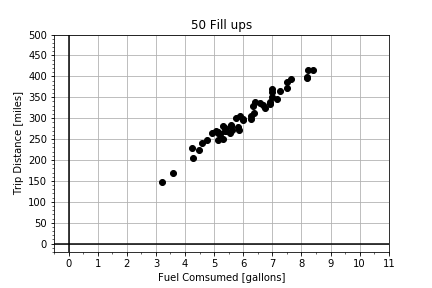
La corrélation est, en essence, la covariance normalisée. Dans cet exercice, deux tableaux de données fortement corrélées vous sont fournis. Vous allez visualiser et calculer à la fois la covariance et la correlation.
Cet exercice fait partie du cours
<cours>Introduction à la modélisation linéaire en Python</cours>Instructions de l’exercice
- Calculez les déviations,
dxetdy, en soustrayant la moyenne avecnp.mean(), puis calculez lacovariancecomme la moyenne de leur produitdx*dy. - Calculez les déviations normalisées,
zxetzy, en divisant par l’écart type avecnp.std(), puis calculez lacorrelationcomme la moyenne de leur produitzx*zy. - Utilisez
plot_normalized_deviations(zx, zy)pour tracer le produit des déviations normalisées et le comparer visuellement à la valeur de corrélation.
Exercice interactif pratique
Essayez cet exercice en complétant ce code d’exemple.
# Compute the covariance from the deviations.
dx = x - np.____(x)
dy = y - np.____(y)
covariance = np.____(____ * ____)
print("Covariance: ", covariance)

# Compute the correlation from the normalized deviations.
zx = dx / np.____(x)
zy = dy / np.____(y)
correlation = np.____(____ * ____)
print("Correlation: ", correlation)

# Plot the normalized deviations for visual inspection.
fig = plot_normalized_deviations(zx, zy)