Representar el modelo junto con los datos
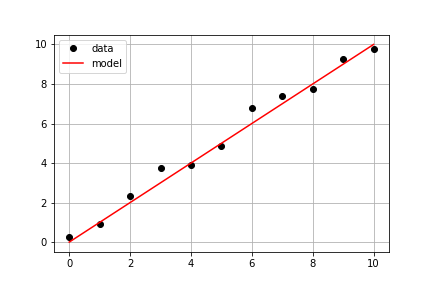
Continuando con los mismos datos medidos del ejercicio anterior, tu objetivo es usar una model() predefinida y los datos medidos times y measured_distances para calcular las distancias modeladas y, después, representar en la misma figura tanto los datos medidos como los modelados.
Este ejercicio forma parte del curso
Introducción al modelado lineal en Python
Instrucciones del ejercicio
- Usa
model_distances = model(times, measured_distances)para calcular los valores modelados. - Usa
plt.subplots()para crear los objetos de figura y ejes. - Usa
axis.plot()para representartimesfrente ameasured_distancescon las opcioneslinestyle=" ", marker="o", color="black". - Usa
axis.plot()para representar tambiéntimesfrente amodel_distancescon las opcioneslinestyle="-", color="red".
ejercicio interactivo práctico
Prueba este ejercicio completando este código de ejemplo.
# Pass times and measured distances into model
model_distances = model(____, ____)

# Create figure and axis objects and call axis.plot() twice to plot data and model distances versus times
fig, axis = plt.subplots()
axis.plot(____, ____, linestyle="____", marker="____", color="____", label="Measured")
axis.plot(____, ____, linestyle="____", marker=None, color="____", label="Modeled")

# Add grid lines and a legend to your plot, and then show to display
axis.grid(True)
axis.legend(loc="best")
plt.show()