Bootstrap y error estándar
Imagina un Parque Nacional donde las personas guardabosques hacen rutas a pie cada día como parte del mantenimiento de los senderos. No siempre siguen el mismo camino, pero sí registran su distancia y tiempo finales. Queremos crear un modelo estadístico de las variaciones en la distancia diaria recorrida a partir de una muestra limitada de datos de una guardabosques.
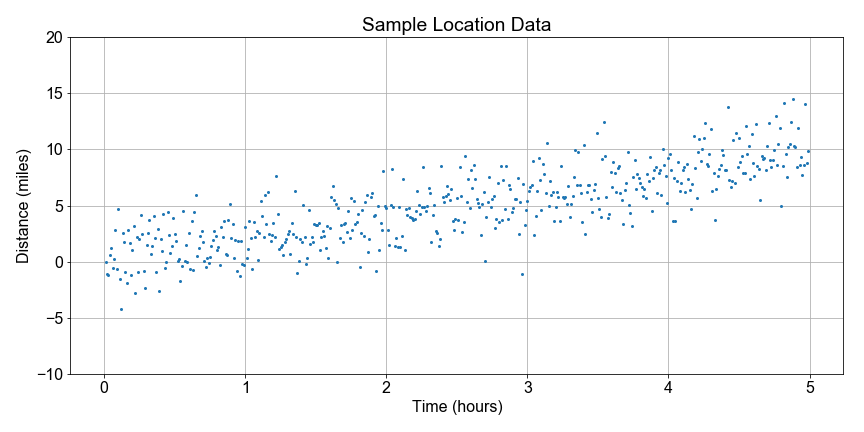
Tu objetivo es usar remuestreo bootstrap, calculando una media para cada remuestra, para crear una distribución de medias, y luego calcular el error estándar como una forma de cuantificar la "incertidumbre" en la estadística muestral como estimador de la estadística poblacional.
Usa el array sample_data precargado con 500 mediciones independientes de distancia recorrida. Por ahora, usamos un conjunto de datos simulado para simplificar esta lección. Más adelante, veremos datos más realistas.
Este ejercicio forma parte del curso
Introducción al modelado lineal en Python
Instrucciones del ejercicio
Asigna
sample_datacomo modelo de la población.Repite
num_resamplesveces:- Usa
np.random.choice()cada vez para generar unbootstrap_sampledesize=resample_sizetomado depopulation_modely especificareplace=True. - Calcula y guarda la media muestral cada vez.
- Usa
Calcula e imprime el
np.mean()y elnp.std()debootstrap_means.Usa la función predefinida
plot_data_hist()y visualiza la distribución debootstrap_means.
ejercicio interactivo práctico
Prueba este ejercicio completando este código de ejemplo.
# Use the sample_data as a model for the population
population_model = ____

# Resample the population_model 100 times, computing the mean each sample
for nr in range(num_resamples):
    bootstrap_sample = np.random.____(population_model, size=____, replace=____)
    bootstrap_means[nr] = np.____(bootstrap_sample)

# Compute and print the mean, stdev of the resample distribution of means
distribution_mean = np.mean(____)
standard_error = np.std(____)
print('Bootstrap Distribution: center={:0.1f}, spread={:0.1f}'.format(____, ____))

# Plot the bootstrap resample distribution of means
fig = plot_data_hist(____)