Estadísticas muestrales frente a poblacionales
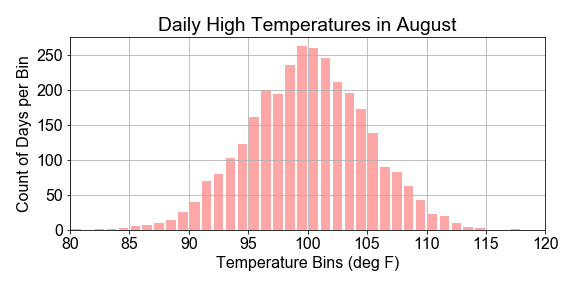
En este ejercicio trabajarás con una population precargada. Construirás una sample extrayendo puntos al azar de la población. Calcularás la media y la desviación estándar de la muestra tomada de esa población para comprobar si la muestra es representativa de la población. Tu objetivo es ver cuándo las estadísticas de la muestra son iguales o muy cercanas a las estadísticas de la población.
Este ejercicio forma parte del curso
Introducción al modelado lineal en Python
Instrucciones del ejercicio
- Calcula e imprime la media y la desviación estándar de los datos de
population. - Usa el método
np.random.seed()para fijar la semilla del generador seudorandom denumpyen42. - Usa
np.random.choice()para crear unasampleconsize=31, donde size es el número de puntos extraídos de lapopulation. - Calcula e imprime la media y la desviación estándar de la
sampley revisa los valores impresos de las estadísticas muestrales y poblacionales para ver si difieren.
ejercicio interactivo práctico
Prueba este ejercicio completando este código de ejemplo.
# Compute the population statistics
print("Population mean {:.1f}, stdev {:.2f}".format( population.____(), population.____() ))

# Set random seed for reproducibility
____.____.____(42)

# Construct a sample by randomly sampling 31 points from the population
sample = np.____.____(____, size=31)

# Compare sample statistics to the population statistics
print("    Sample mean {:.1f}, stdev {:.2f}".format( sample.____(), sample.____() ))