Gráfico de calidad por base
Esta figura se ha creado para ti a partir de las codificaciones de calidad por base de un archivo fastq completo. Este archivo usa la codificación de Illumina. La codificación máxima es I, o una puntuación de 40. Las codificaciones de buena calidad tienen puntuaciones de 33 o superiores, o dicho de otro modo, son B o superiores.
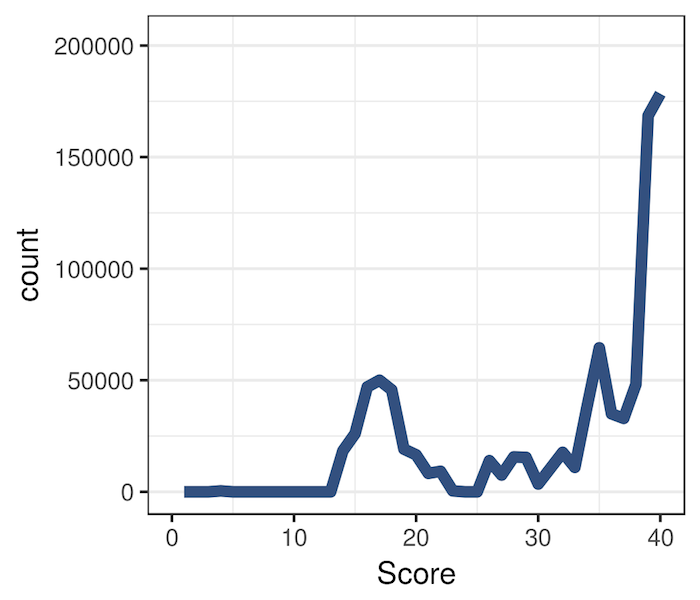
Puedes ver los detalles de la codificación de Illumina aquí.
- ¿Qué puntuaciones están más representadas en la figura?
Este ejercicio forma parte del curso
Introducción a Bioconductor en R
ejercicio interactivo práctico
Convierte la teoría en práctica con uno de nuestros ejercicios interactivos
 Empezar ejercicio