Partielle Autokorrelationsdiagramme interpretieren
Wenn partielle Autokorrelationswerte nahe 0 liegen, sind Werte zwischen Beobachtungen und verzögerten Beobachtungen nicht miteinander korreliert. Umgekehrt deuten partielle Autokorrelationen mit Werten nahe 1 oder -1 auf eine starke positive bzw. negative Korrelation zwischen den verzögerten Beobachtungen der Zeitreihe hin.
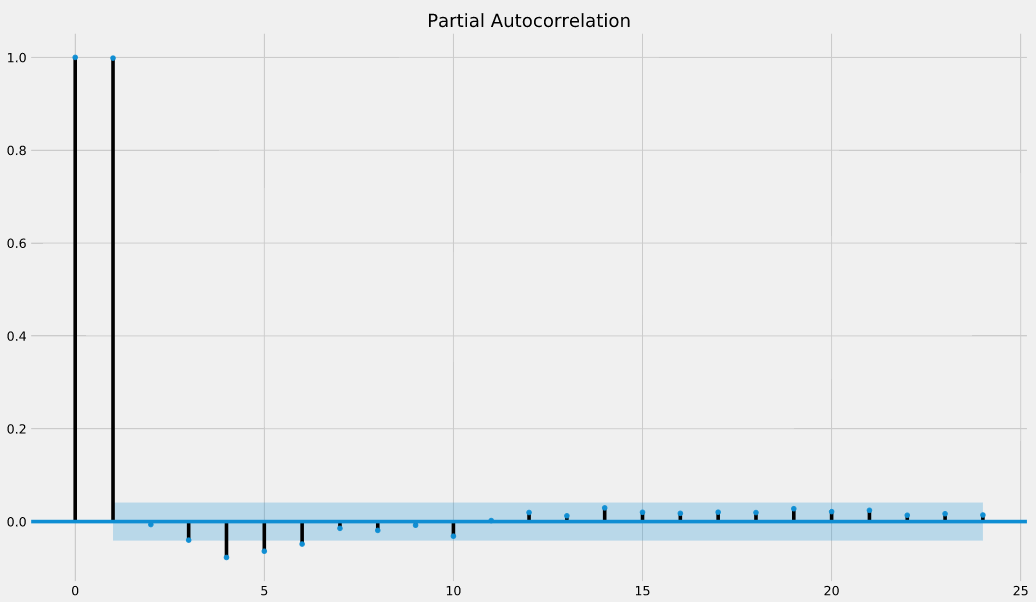
Die Funktion .plot_pacf() gibt auch Konfidenzintervalle zurück, die als blau schattierte Bereiche dargestellt sind. Wenn partielle Autokorrelationswerte außerhalb dieser Konfidenzintervall-Bereiche liegen, kannst du davon ausgehen, dass die beobachteten partiellen Autokorrelationswerte statistisch signifikant sind.
In dem partiellen Autokorrelationsdiagramm unten: Bei welchen Lag-Werten haben wir statistisch signifikante partielle Autokorrelationen?
Diese Übung ist Teil des Kurses
<Kurs>Zeitreihendaten in Python visualisieren</Kurs>Interaktive praktische Übung
Verwandle Theorie mit einer unserer interaktiven Übungen in die Praxis
 Übung starten