Autokorrelationsplots interpretieren
Wenn Autokorrelationswerte nahe 0 liegen, sind die Werte aufeinanderfolgender Beobachtungen nicht miteinander korreliert. Umgekehrt deuten Autokorrelationswerte nahe 1 bzw. -1 darauf hin, dass zwischen aufeinanderfolgenden Beobachtungen eine starke positive bzw. negative Korrelation besteht.
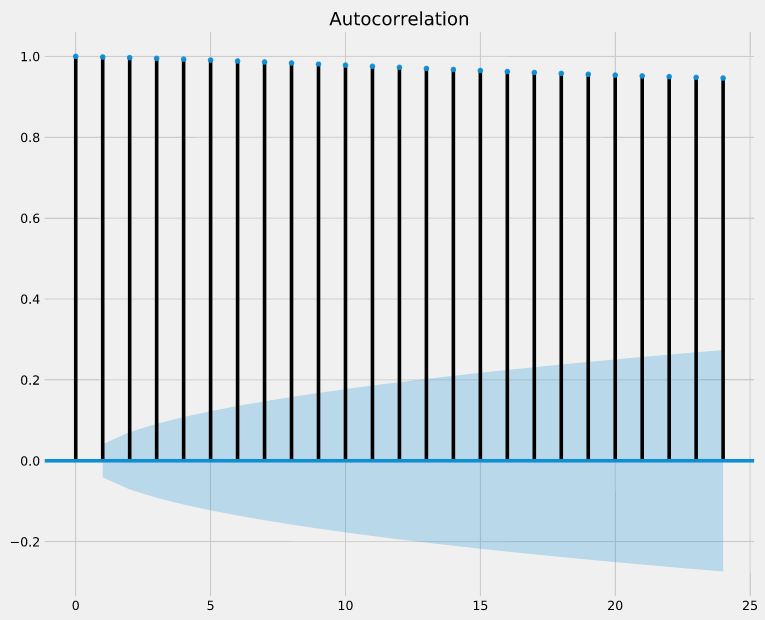
Damit du besser einschätzen kannst, wie verlässlich diese Autokorrelationswerte sind, gibt die Funktion plot_acf() auch Konfidenzintervalle zurück (dargestellt als blau schattierte Bereiche). Wenn ein Autokorrelationswert außerhalb des Konfidenzintervalls liegt, kannst du davon ausgehen, dass der beobachtete Autokorrelationswert statistisch signifikant ist.
Sind in dem Autokorrelationsplot unten aufeinanderfolgende Beobachtungen stark korreliert (d. h. größer als 0,5) und statistisch signifikant?
Diese Übung ist Teil des Kurses
<Kurs>Zeitreihendaten in Python visualisieren</Kurs>Interaktive praktische Übung
Verwandle Theorie mit einer unserer interaktiven Übungen in die Praxis
 Übung starten