Die effiziente Grenze
Eine Möglichkeit, die effiziente Grenze von Risiko vs. Rendite für einen Satz von Assets zu konstruieren, besteht darin, zufällig Portfoliokombinationen zu erzeugen und die Kennzahlen jedes Portfolios zu plotten. In diesem Diagramm ist die x-Achse das Risiko (Standardabweichung) und die y-Achse die erwartete Rendite jedes Portfolios.
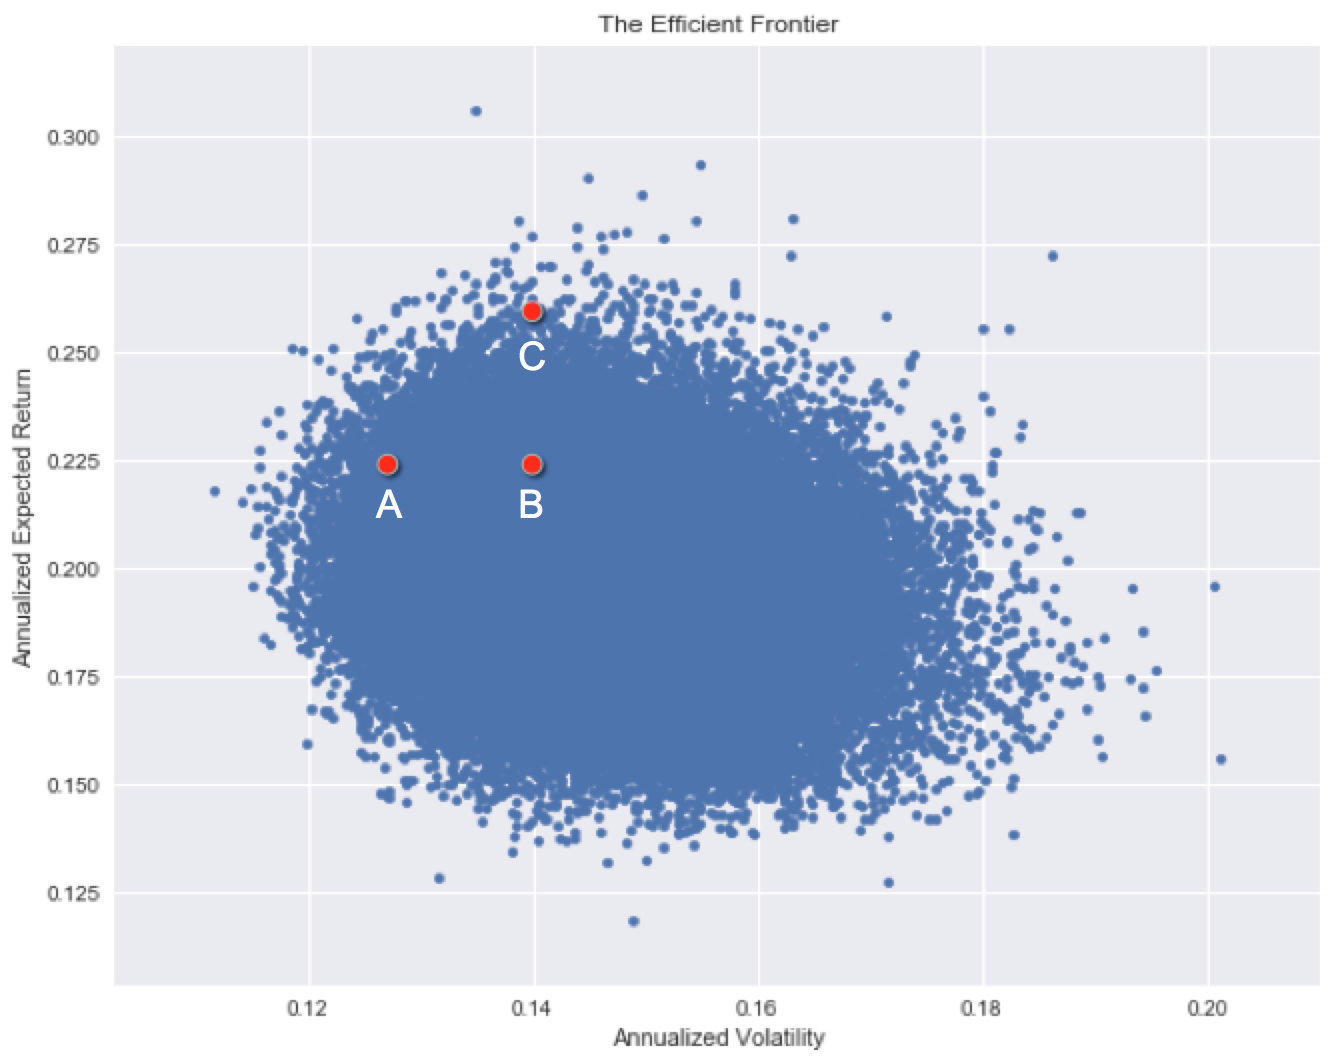
Jede Anlage hat ein historisches Risikoniveau und eine historische Rendite. Beachte, dass einige Assets historisch anderen überlegen sind, während sich zwischen manchen nur schwer entscheiden lässt.
Welche Anlage hat historisch die besten Risiko-/Rendite-Eigenschaften?
Diese Übung ist Teil des Kurses
<Kurs>Einführung in das Portfoliorisikomanagement mit Python</Kurs>Interaktive praktische Übung
Verwandle Theorie mit einer unserer interaktiven Übungen in die Praxis
 Übung starten