先验与数据对后验的影响
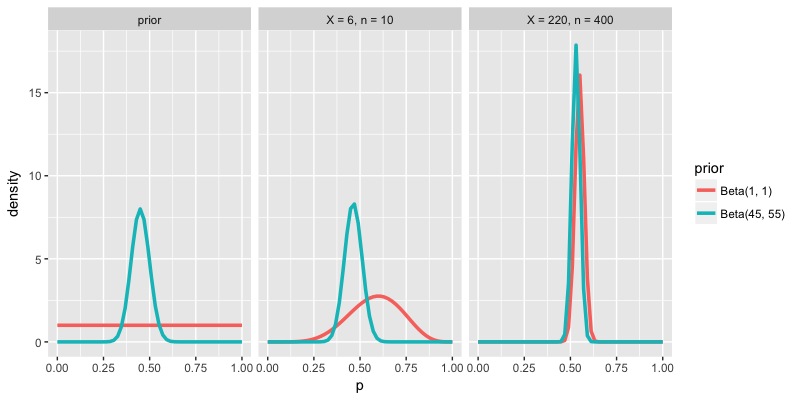
请查看下方的密度图。第一组密度图展示了潜在支持率 \(p\) 的 2 种可能的先验。其余 2 组密度图展示了在不同先验以及不同民调数据 \(X\) 和 \(n\) 下得到的 \(p\) 的后验模型。以下哪一项最能描述先验与数据共同对后验的影响?
本练习是课程的一部分
请查看下方的密度图。第一组密度图展示了潜在支持率 \(p\) 的 2 种可能的先验。其余 2 组密度图展示了在不同先验以及不同民调数据 \(X\) 和 \(n\) 下得到的 \(p\) 的后验模型。以下哪一项最能描述先验与数据共同对后验的影响?
本练习是课程的一部分
