A fronteira eficiente
Uma das formas de construir a fronteira eficiente de risco vs. retorno, dado um conjunto de ativos, é gerar combinações aleatórias e plotar as características de cada portfólio. Neste gráfico, o eixo x é o risco (desvio padrão) e o eixo y é o retorno esperado de cada portfólio.
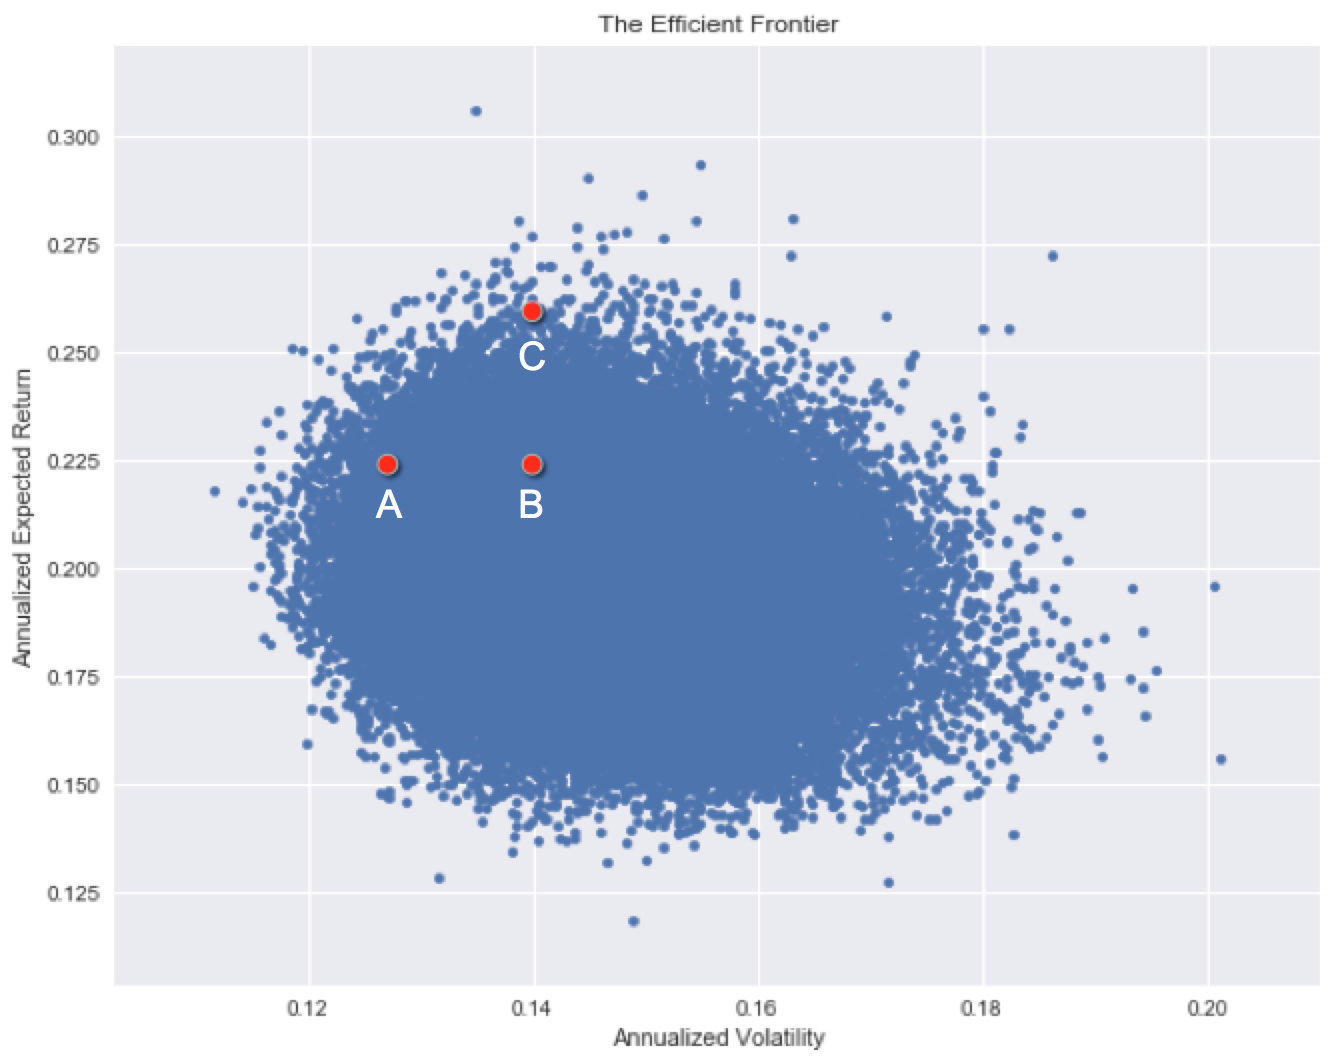
Cada investimento tem um nível histórico de risco e um retorno histórico. Note como alguns ativos foram historicamente superiores a outros, mas alguns são difíceis de comparar.
Qual investimento tem as melhores características históricas de risco/retorno?
Este exercicio faz parte do curso
Introdução ao Gerenciamento de Risco de Portfólio em Python
exercicio interativo prático
Transforme teoria em prática com um dos nossos exercicio interativos
 Iniciar exercicio