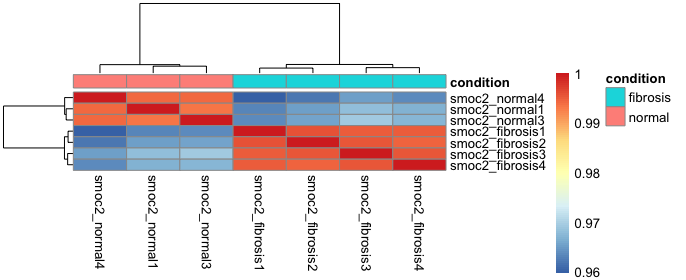
Analyse de carte thermique hiérarchique
D’après la carte thermique réalisée à l’exercice précédent (affichée ci-dessous), choisissez la réponse qui décrit le mieux ce graphique.
Cet exercice fait partie du cours
<cours>RNA-Seq avec Bioconductor en R</cours>Exercice interactif pratique
Transformez la théorie en action avec l’un de nos exercices interactifs
 Commencer l’exercice