La frontière efficiente
L’une des façons de construire la frontière efficiente risque/rendement pour un ensemble d’actifs consiste à générer aléatoirement des combinaisons et à tracer les caractéristiques de chaque portefeuille. Sur ce graphique, l’axe des x représente le risque (écart type) et l’axe des y le rendement attendu de chaque portefeuille.
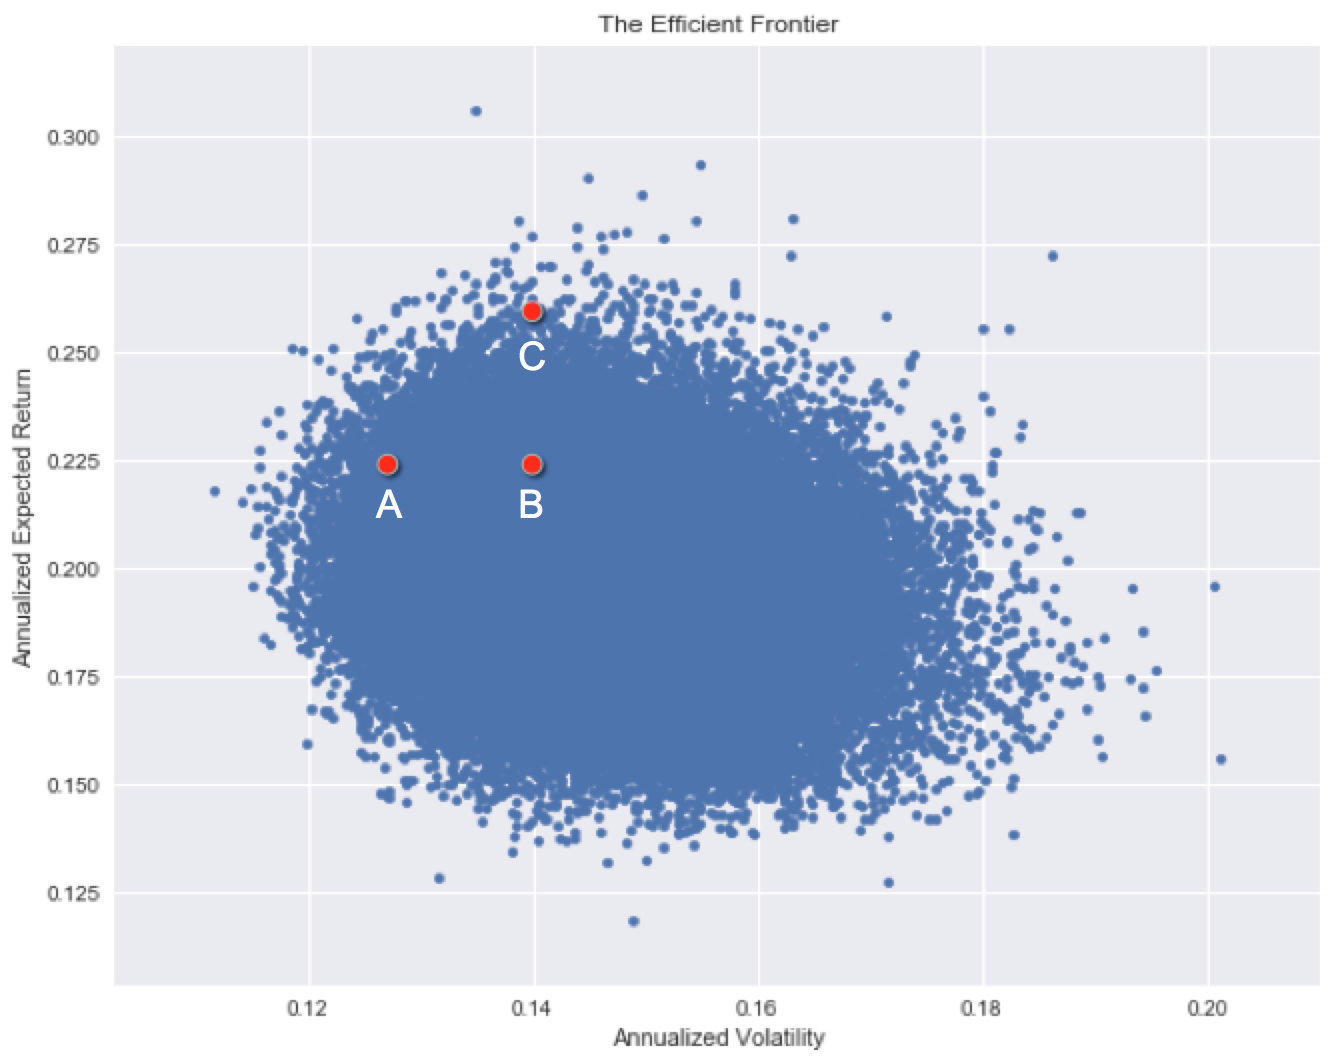
Chaque investissement possède un niveau de risque historique et un rendement historique. Notez que certains actifs ont historiquement été plus performants que d’autres, tandis que d’autres sont difficiles à départager.
Quel investissement présente les meilleures caractéristiques risque/rendement historiques ?
Cet exercice fait partie du cours
<cours>Introduction à la gestion du risque de portefeuille en Python</cours>Exercice interactif pratique
Transformez la théorie en action avec l’un de nos exercices interactifs
 Commencer l’exercice