La frontera eficiente
Una manera de construir la frontera eficiente de riesgo frente a rentabilidad para un conjunto de activos es generar combinaciones aleatorias y representar las características de cada cartera. En este gráfico, el eje x es el riesgo (desviación estándar) y el eje y es la rentabilidad esperada de cada cartera.
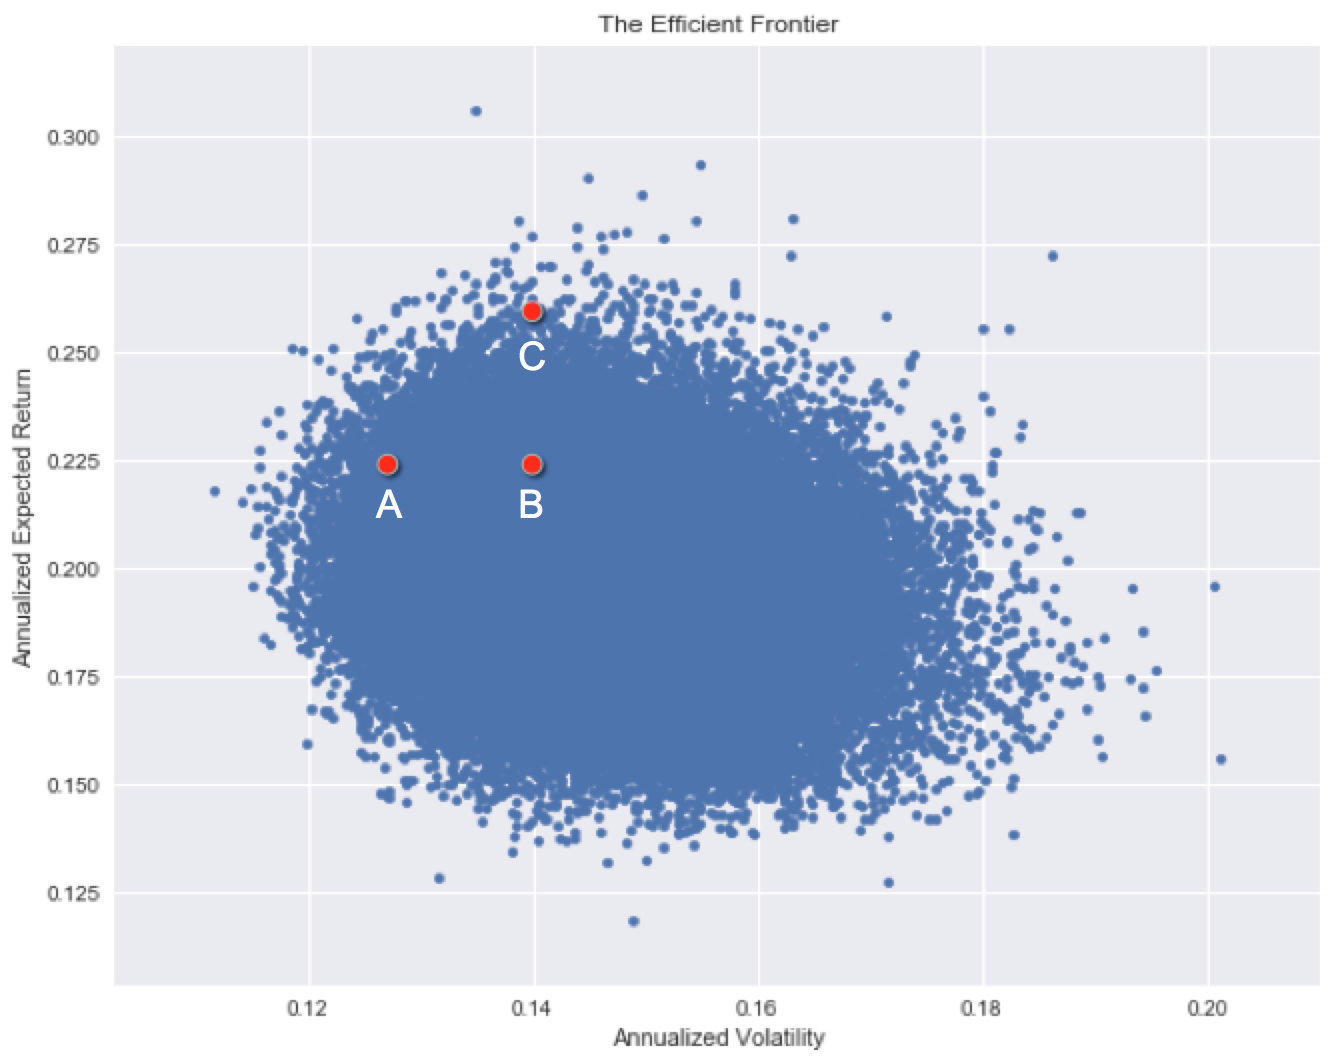
Cada inversión tiene un nivel de riesgo histórico y una rentabilidad histórica. Observa cómo algunos activos han sido históricamente superiores a otros, pero entre algunos la elección no es tan clara.
¿Qué inversión tiene las mejores características históricas de riesgo/rentabilidad?
Este ejercicio forma parte del curso
Introducción a la gestión del riesgo de cartera en Python
ejercicio interactivo práctico
Convierte la teoría en práctica con uno de nuestros ejercicios interactivos
 Empezar ejercicio