Interpreta i grafici di autocorrelazione
Se i valori di autocorrelazione sono vicini a 0, allora i valori tra osservazioni consecutive non sono correlati tra loro. Al contrario, valori di autocorrelazione vicini a 1 o a -1 indicano una forte correlazione positiva o negativa tra osservazioni consecutive, rispettivamente.
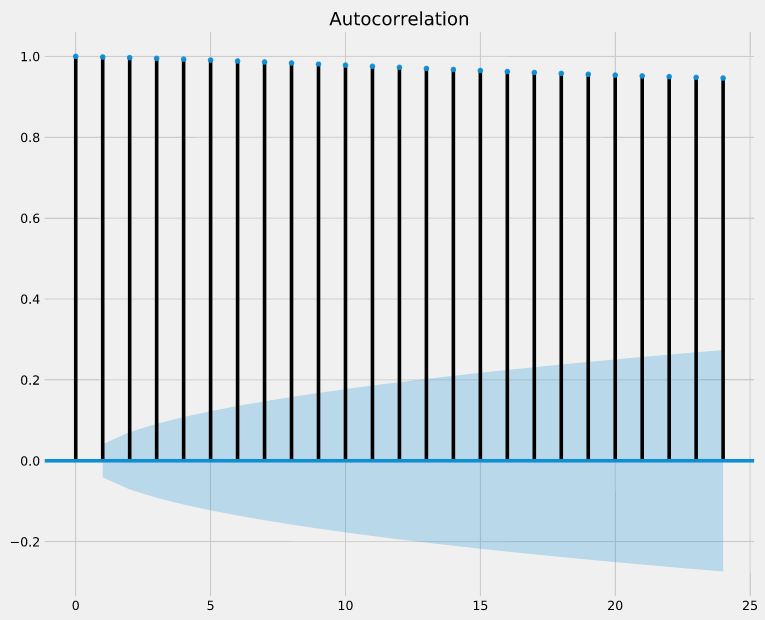
Per aiutarti a valutare l’affidabilità di questi valori di autocorrelazione, la funzione plot_acf() restituisce anche intervalli di confidenza (rappresentati come aree azzurre). Se un valore di autocorrelazione supera la regione dell’intervallo di confidenza, puoi assumere che l’autocorrelazione osservata sia statisticamente significativa.
Nel grafico di autocorrelazione qui sotto, le osservazioni consecutive sono altamente correlate (cioè superiori a 0,5) e statisticamente significative?
Questo esercizio fa parte del corso
Visualizzare dati di serie temporali in Python
esercizio interattivo pratico
Trasforma la teoria in pratica con uno dei nostri esercizi interattivi
 Inizia esercizio