Interpretar gráficos de autocorrelación parcial
Si los valores de autocorrelación parcial están cerca de 0, entonces los valores entre observaciones y observaciones retardadas no están correlacionados entre sí. Por el contrario, autocorrelaciones parciales con valores cercanos a 1 o -1 indican que existen correlaciones positivas o negativas fuertes entre las observaciones retardadas de la serie temporal.
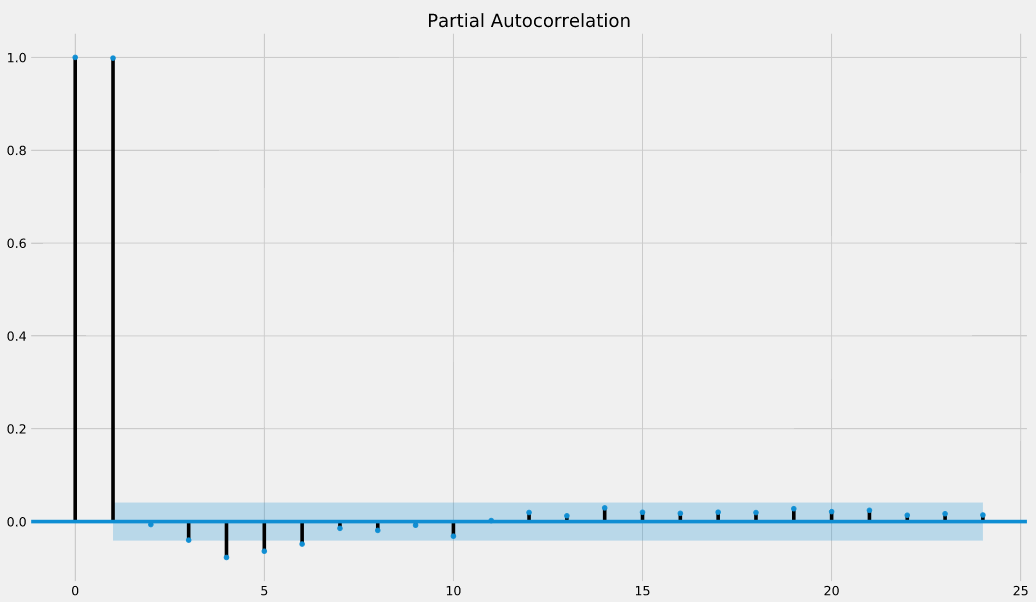
La función .plot_pacf() también devuelve intervalos de confianza, que se representan como regiones sombreadas en azul. Si los valores de autocorrelación parcial están fuera de estas regiones del intervalo de confianza, entonces puedes asumir que los valores observados de autocorrelación parcial son estadísticamente significativos.
En el gráfico de autocorrelación parcial de abajo, ¿en qué retardos tenemos autocorrelaciones parciales estadísticamente significativas?
Este ejercicio forma parte del curso
Visualización de datos temporales en Python
ejercicio interactivo práctico
Convierte la teoría en práctica con uno de nuestros ejercicios interactivos
 Empezar ejercicio