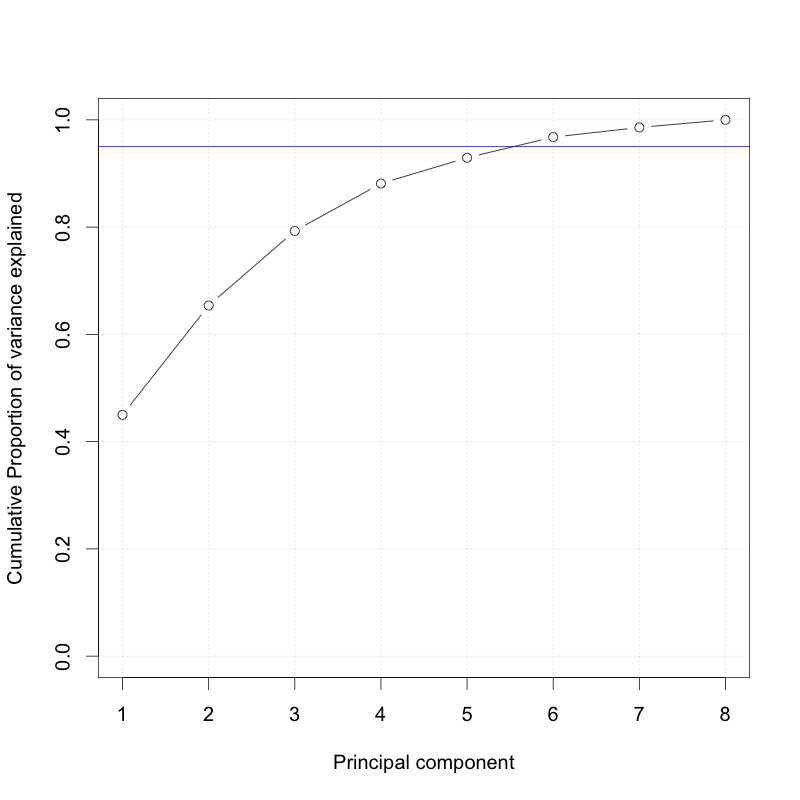
Number of components explaining 95% variation
Based on the plot from the previous exercise, which is shown below, how many components are needed to explain 95% of the variation in the data?
Diese Übung ist Teil des Kurses
<Kurs>Multivariate Probability Distributions in R</Kurs>Interaktive praktische Übung
Verwandle Theorie mit einer unserer interaktiven Übungen in die Praxis
 Übung starten