Bestimme die Verteilung
Unten siehst du ein Streudiagramm von 1000 Stichproben aus drei bivariaten Verteilungen mit demselben Lageparameter und derselben Varianz-Kovarianz-Matrix:
- Eine multivariate t-Verteilung mit 4 Freiheitsgraden (T4)
- Eine multivariate t-Verteilung mit 8 Freiheitsgraden (T8)
- Eine multivariate Normalverteilung (Normal)
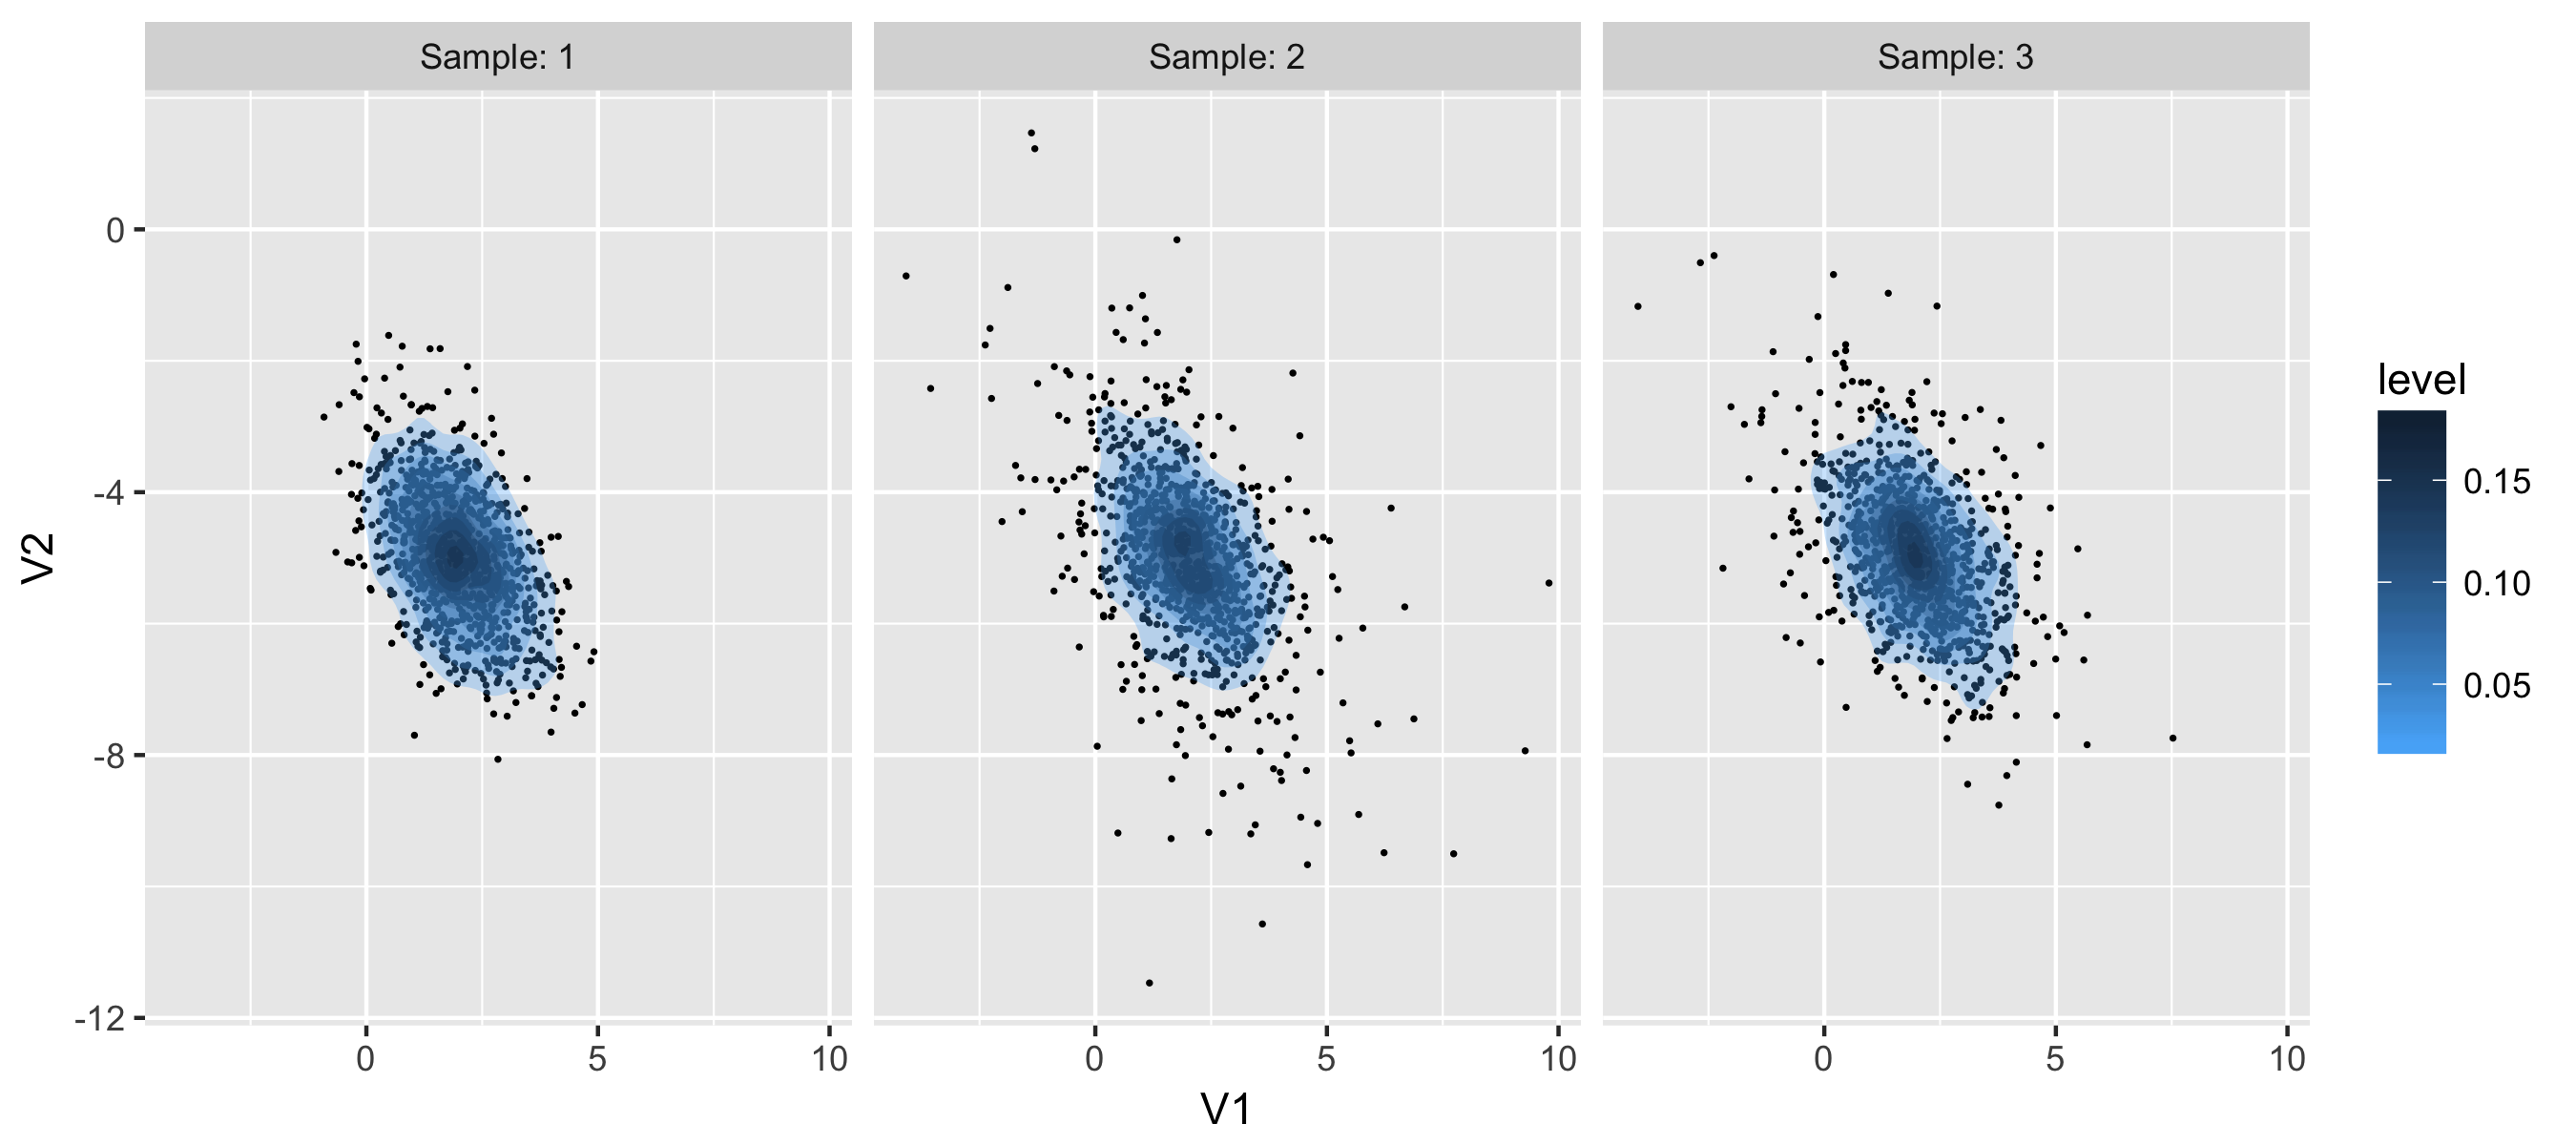
Welche Zuordnung der oben genannten Verteilungen zu den Stichproben 1 bis 3 ist korrekt?
Diese Übung ist Teil des Kurses
<Kurs>Multivariate Wahrscheinlichkeitsverteilungen in R</Kurs>Interaktive praktische Übung
Verwandle Theorie mit einer unserer interaktiven Übungen in die Praxis
 Übung starten