Metriken aus der Confusion-Matrix berechnen
Die Confusion-Matrix eines binären Klassifikationsmodells listet die Anzahl korrekter und inkorrekter Vorhersagen auf dem Testdatensatz auf und hilft dabei, die Leistung deines Modells zu bewerten.
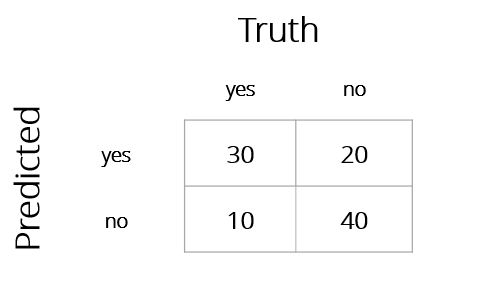
Angenommen, du hast ein Klassifikationsmodell trainiert, das vorhersagt, ob Kundinnen und Kunden ihren Service bei einem Telekommunikationsunternehmen kündigen, und du erhältst auf deinem Testdatensatz die folgende Confusion-Matrix. Hier steht yes für die positive Klasse und no für die negative Klasse.
Wähle die korrekte Aussage aus den folgenden Optionen.
Diese Übung ist Teil des Kurses
<Kurs>Modellierung mit tidymodels in R</Kurs>Interaktive praktische Übung
Verwandle Theorie mit einer unserer interaktiven Übungen in die Praxis
 Übung starten