插值:时间间隔内的预测
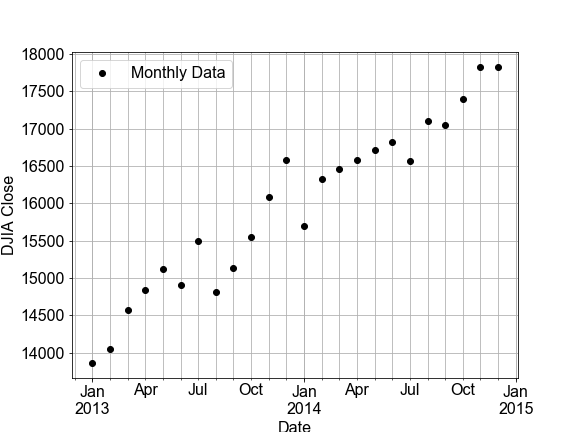
在本练习中,您将通过拟合道琼斯工业平均指数(DJIA)的月度时间序列来构建线性模型,然后用该模型对日度数据进行预测(本质上是一次插值)。接着,您将把该日度预测与真实的日度 DJIA 数据进行比较。
关于数据的几点说明:"OHLC" 代表 "Open-High-Low-Close"(开盘价-最高价-最低价-收盘价),通常是按日度提供,例如某只股票在某天的开盘与收盘价格,以及当日最高与最低价格。"DayCount" 是从数据收集开始起算的天数(整数)。
本练习是课程的一部分
Python 线性建模入门
练习说明
- 使用
ols()并调用.fit(),在data=df_monthly上拟合模型,formula="Close ~ DayCount"。 - 对
df_monthly.DayCount和df_daily.DayCount都调用model_fit.predict(),预测月度与日度的Close价格,并在各自的 DataFrame 中将结果存为新列Model。 - 使用预定义的
plot_model_with_data各运行一次,分别对df_monthly和df_daily绘图,并比较显示的 RSS 值。
交互式实操练习
通过完成这段示例代码来试试这个练习。
# build and fit a model to the df_monthly data
model_fit = ols('Close ~ DayCount', ____=df_monthly).____()

# Use the model FIT to the MONTHLY data to make a predictions for both monthly and daily data
df_monthly['Model'] = model_fit.____(df_monthly.____)
df_daily['Model'] = model_fit.____(df_daily.____)

# Plot the monthly and daily data and model, compare the RSS values seen on the figures
fig_monthly = plot_model_with_data(____)
fig_daily = plot_model_with_data(____)