绘制数据
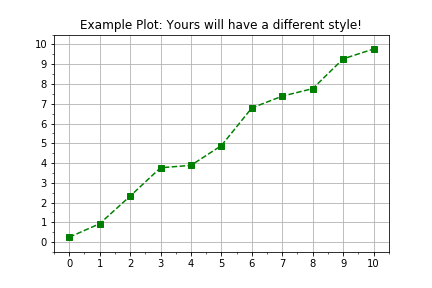
在 Python 中,一切都是对象,模块也不例外。本练习的目标是带您回顾如何使用 Python 库 matplotlib 的面向对象接口,更灵活、可扩展地可视化测量数据。通用的绘图流程如下:
import matplotlib.pyplot as plt
fig, axis = plt.subplots()
axis.plot(x, y, color="green", linestyle="--", marker="s")
plt.show()
本练习是课程的一部分
Python 线性建模入门
练习说明
- 使用
plt.subplots()创建 figure 和 axis 对象。 - 两个预先定义的
numpy数组times和distances已提供数据。 - 使用
axis.plot()将times作为横轴、distances作为纵轴进行绘图。 - 调用
axis.plot()时,使用关键字参数linestyle=" "、marker="o"和color="red"。
交互式实操练习
通过完成这段示例代码来试试这个练习。
# Create figure and axis objects using subplots()
fig, axis = plt.____()

# Plot line using the axis.plot() method
line = axis.plot(____ , ____ , linestyle="____", marker="____", color="____")

# Use the plt.show() method to display the figure
plt.____()