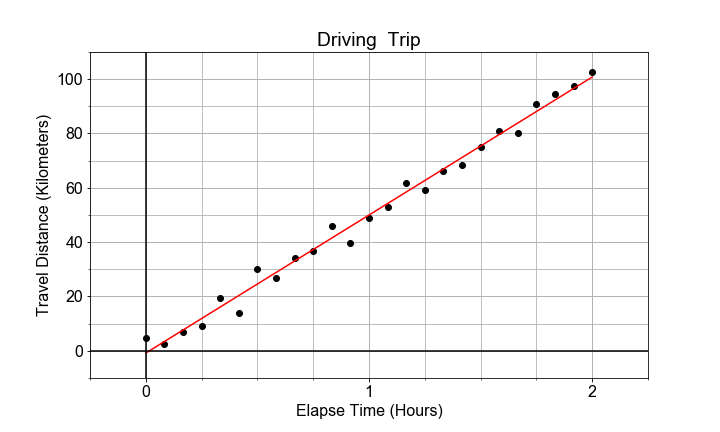
围绕趋势的波动
数据不必完全线性,测量中可能存在一些随机波动或"离散"。这些波动会反映到模型参数的变化上。参数上的这种变化用"标准误"来量化,并可解释为对模型参数估计的"不确定性"。
在本练习中,您将使用 statsmodels 中的 ols 来建立模型,并提取该模型每个参数的标准误。
本练习是课程的一部分
Python 线性建模入门
练习说明
- 将预加载的数据存入 DataFrame
df,并将x_data标记为times、y_data标记为distances。 - 使用
model_fit = ols().fit()拟合线性模型,形式为formula="distances ~ times",并指定data=df。 - 提取估计的截距
model_fit.params['Intercept'],以及其标准误model_fit.bse['Intercept']。 - 对斜率重复上述步骤,然后用有意义的名称打印这 4 个值。
交互式实操练习
通过完成这段示例代码来试试这个练习。
# Store x_data and y_data, as times and distances, in df, and use ols() to fit a model to it.
df = pd.DataFrame(dict(____=x_data, ____=y_data))
model_fit = ols(____="distances ~ times", data=____).____()

# Extact the model parameters and their uncertainties
a0 = model_fit.____['Intercept']
e0 = model_fit.____['Intercept']
a1 = model_fit.____['times']
e1 = model_fit.____['times']

# Print the results with more meaningful names
print('Estimate    of the intercept = {:0.2f}'.format(____))
print('Uncertainty of the intercept = {:0.2f}'.format(____))
print('Estimate    of the slope = {:0.2f}'.format(____))
print('Uncertainty of the slope = {:0.2f}'.format(____))