在数据上绘制模型
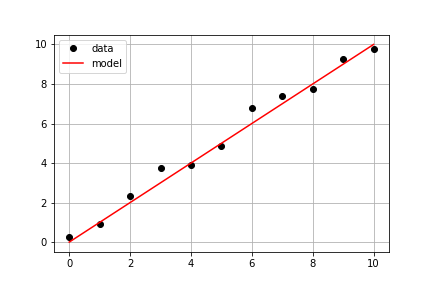
延续上一个练习中的同一组实测数据,您的目标是使用预定义的 model() 以及实测数据 times 和 measured_distances 计算模型距离,然后在同一坐标轴上同时绘制实测数据和模型数据。
本练习是课程的一部分
Python 线性建模入门
练习说明
- 使用
model_distances = model(times, measured_distances)计算模型值。 - 使用
plt.subplots()创建图形和坐标轴对象。 - 使用
axis.plot()绘制times与measured_distances,并设置参数linestyle=" ", marker="o", color="black"。 - 再使用
axis.plot()绘制times与model_distances,并设置参数linestyle="-", color="red"。
交互式实操练习
通过完成这段示例代码来试试这个练习。
# Pass times and measured distances into model
model_distances = model(____, ____)

# Create figure and axis objects and call axis.plot() twice to plot data and model distances versus times
fig, axis = plt.subplots()
axis.plot(____, ____, linestyle="____", marker="____", color="____", label="Measured")
axis.plot(____, ____, linestyle="____", marker=None, color="____", label="Modeled")

# Add grid lines and a legend to your plot, and then show to display
axis.grid(True)
axis.legend(loc="best")
plt.show()