自助法与标准误
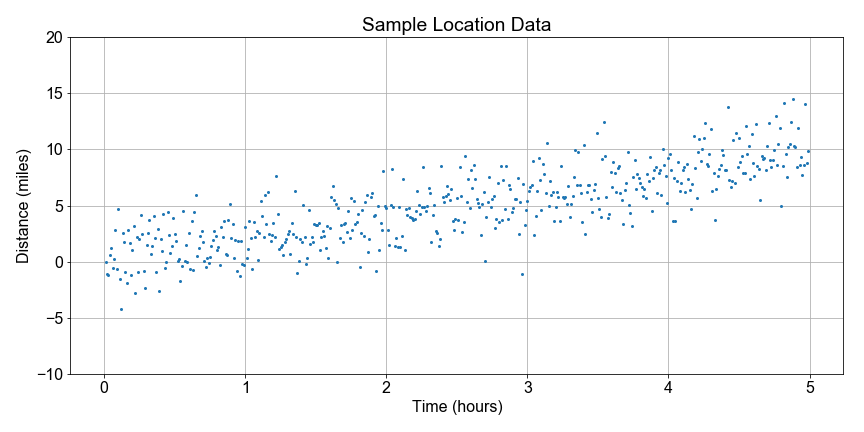
想象在一座国家公园里,巡护员每天徒步以维护步道。他们并不总是走同一条路线,但会记录最终的路程和时间。我们希望用来自某一位巡护员的有限样本数据来建立一个关于每日行走距离波动的统计模型。
您的目标是使用自助法重采样,对每个重采样计算一个均值,从而形成均值的分布;然后计算标准误,用它来量化作为总体统计量估计量的"样本统计量"的不确定性。
使用预加载的 sample_data 数组,其中包含 500 个关于行走距离的独立观测。为简化本节内容,我们暂时使用模拟数据集。后续我们会看到更贴近现实的数据。
本练习是课程的一部分
Python 线性建模入门
练习说明
将
sample_data作为总体的模型进行赋值。迭代执行
num_resamples次:- 每次使用
np.random.choice(),从population_model中生成一个大小为resample_size的bootstrap_sample,并指定replace=True。 - 每次计算并存储该样本的均值。
- 每次使用
计算并打印
bootstrap_means的np.mean()和np.std()。使用预定义的
plot_data_hist()可视化bootstrap_means的分布。
交互式实操练习
通过完成这段示例代码来试试这个练习。
# Use the sample_data as a model for the population
population_model = ____

# Resample the population_model 100 times, computing the mean each sample
for nr in range(num_resamples):
    bootstrap_sample = np.random.____(population_model, size=____, replace=____)
    bootstrap_means[nr] = np.____(bootstrap_sample)

# Compute and print the mean, stdev of the resample distribution of means
distribution_mean = np.mean(____)
standard_error = np.std(____)
print('Bootstrap Distribution: center={:0.1f}, spread={:0.1f}'.format(____, ____))

# Plot the bootstrap resample distribution of means
fig = plot_data_hist(____)