均值、偏差与标准差
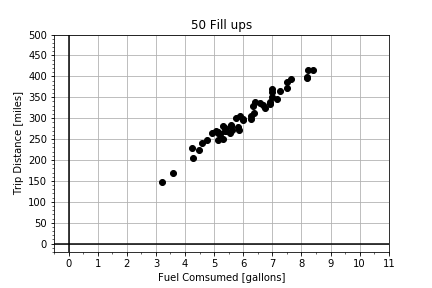
均值用于描述数据的中心位置,标准差用于描述数据的离散程度。但要比较两个变量,通常先将二者都做归一化更为方便。本练习为您提供两组高度相关的数据数组,您将计算并可视化每个数组的归一化偏差。
本练习是课程的一部分
Python 线性建模入门
练习说明
- 计算偏差
dx和dy。 - 计算归一化偏差
zx和zy。 - 调用
plot_cdfs(),查看原始数据与归一化数据的比较。
交互式实操练习
通过完成这段示例代码来试试这个练习。
# Compute the deviations by subtracting the mean offset
dx = x - np.____(x)
dy = y - np.____(y)

# Normalize the data by dividing the deviations by the standard deviation
zx = dx / np.____(x)
zy = dy / np.____(y)

# Plot comparisons of the raw data and the normalized data
fig = plot_cdfs(dx, dy, zx, zy)