Identifică distribuția unui eșantion normal
Mai jos găsești un grafic ggpairs obținut dintr-un eșantion normal trivariat cu n = 1000.
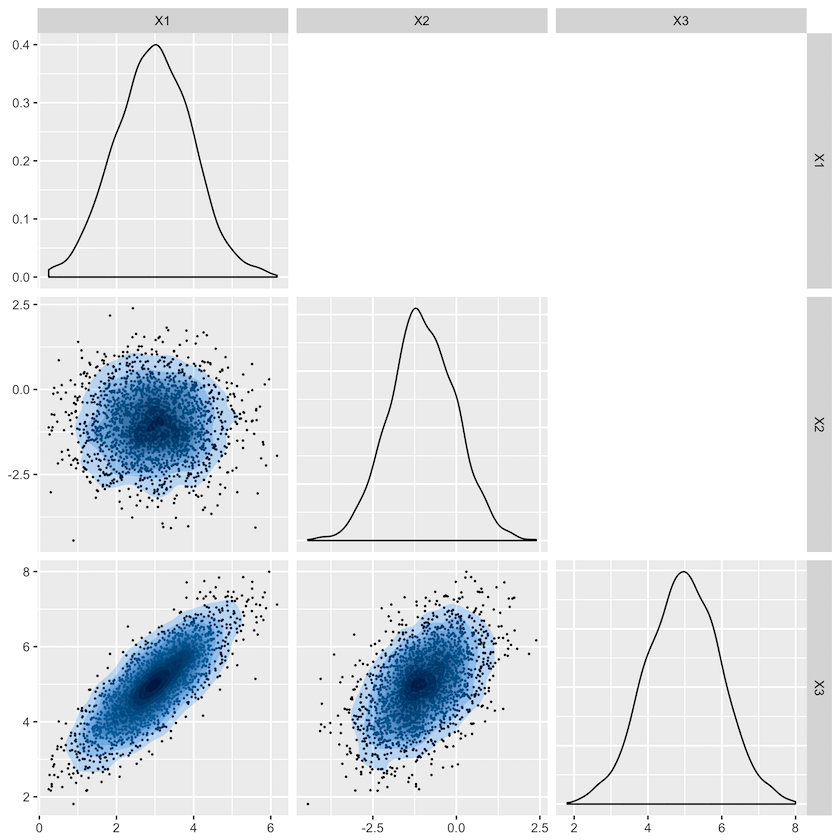
Care este cea mai probabilă pereche de valori mu și sigma care a generat acest eșantion?
$$\mbox{(a)}\quad \mu= \begin{pmatrix} 3 \\ 1 \\ 2 \end{pmatrix}, \Sigma={\begin{pmatrix} 1 & 0.6 & 0.4 \\ 0.6 & 1 & 0.5 \\ 0.4 & 0.5 & 1 \end{pmatrix}}$$
$$ \mbox{(b)} \quad\mu= \begin{pmatrix} 3 \\ 1 \\ 2 \end{pmatrix}, \Sigma={\begin{pmatrix} 1 & 0 & 0.8 \\ 0 & 1 & 0.5 \\ 0.8 & 0.5 & 1 \end{pmatrix}}$$
$$\mbox{(c)} \quad\mu= \begin{pmatrix} 3 \\ -1 \\ 5 \end{pmatrix}, \Sigma={\begin{pmatrix} 1 & 0.6 & 0.4 \\ 0.6 & 1 & 0.5 \\ 0.4 & 0.5 & 1 \end{pmatrix}}$$
$$\mbox{(d)} \quad \mu= \begin{pmatrix} 3 \\ -1 \\ 5 \end{pmatrix}, \Sigma={\begin{pmatrix} 1 & 0 & 0.8 \\ 0 & 1 & 0.5 \\ 0.8 & 0.5 & 1 \end{pmatrix}}$$
Acest exercițiu face parte din cursul
Distribuții de probabilitate multivariate în R
Exercițiu interactiv practic
Transformă teoria în practică cu unul dintre exercițiile noastre interactive
 Începe exercițiul