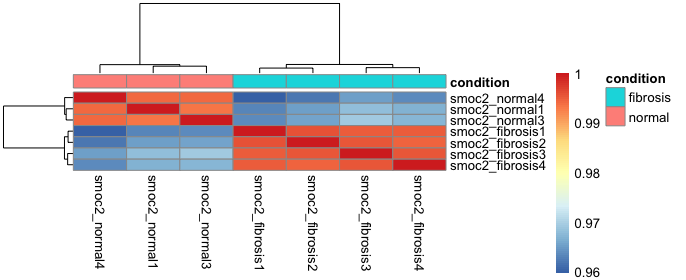
Hiërarchische heatmap-analyse
Kies op basis van de heatmap die je in de vorige oefening hebt gemaakt (hieronder getoond) het antwoord dat de plot het best beschrijft.
Deze oefening maakt deel uit van de cursus
RNA-Seq met Bioconductor in R
Interactieve oefening met praktijkervaring
Zet theorie om in actie met een van onze interactieve oefeningen
 Begin oefening