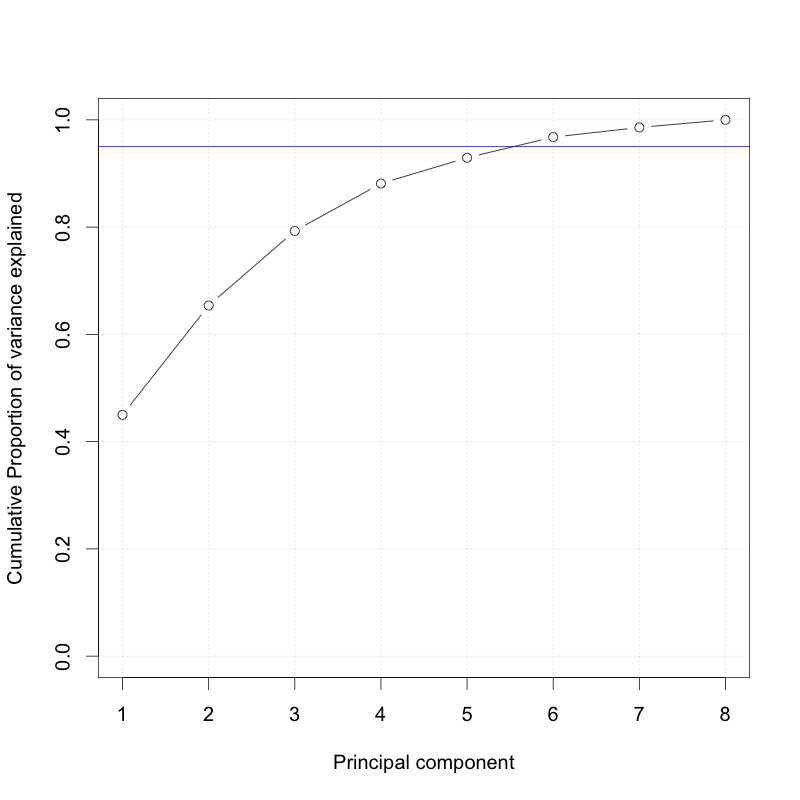
Numero di componenti che spiegano il 95% della variazione
In base al grafico dell'esercizio precedente, mostrato qui sotto, di quante componenti hai bisogno per spiegare il 95% della variazione nei dati?
Questo esercizio fa parte del corso
Distribuzioni di probabilità multivariate in R
esercizio interattivo pratico
Trasforma la teoria in pratica con uno dei nostri esercizi interattivi
 Inizia esercizio