Uji A/B dasar
Sekarang setelah kita mengetahui ukuran sampel yang diperlukan dan kita membiarkan eksperimen berjalan cukup lama hingga memperoleh setidaknya 400 orang di setiap grup, kita dapat menganalisis uji A/B kita.
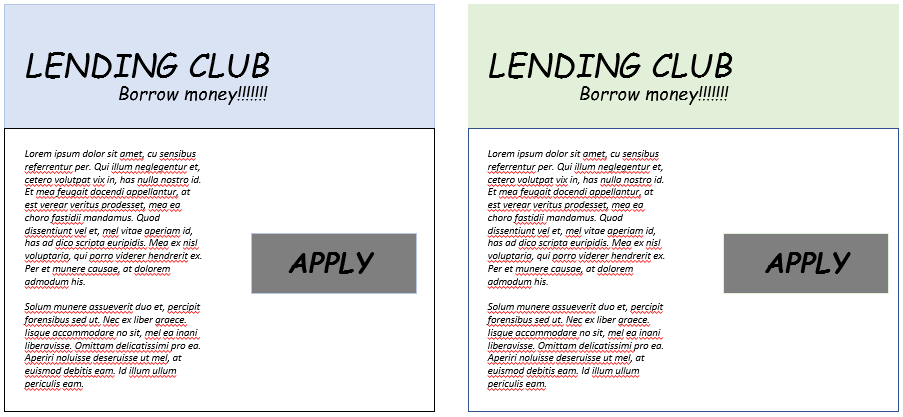
Ingat bahwa saat pelamar menggunakan situs web Lending Club, mereka secara acak ditempatkan ke dua grup, A atau B, di mana A ditampilkan header situs web hijau mint dan B ditampilkan header situs web biru muda. Lending Club ingin mengetahui apakah pilihan warna header situs web memengaruhi loan_amnt, yaitu jumlah yang diminta peminjam.
Satu himpunan data baru, lendingclub_ab, tersedia di workspace Anda. Uji A/B dijalankan hingga ada 500 pelamar di setiap grup. Setiap pelamar telah diberi label sebagai grup A atau B. Lakukan uji yang sesuai untuk melihat apakah mean loan_amnt berbeda antara kedua grup.
Latihan ini merupakan bagian dari kursus
Perancangan Eksperimen di R
Instruksi latihan
- Buat boxplot
loan_amntmenurutGroupmenggunakanggplot2. - Lakukan uji t dua sisi untuk menguji hasil uji A/B.
Latihan interaktif langsung praktik
Cobalah latihan ini dengan melengkapi kode contoh ini.
# Plot the A/B test results
ggplot(___, aes(x = ___, y = ___)) +
	geom_boxplot()

# Conduct a two-sided t-test
t.test(___ ~ ___, data = ___)