Identifier la distribution d'un échantillon normal
Vous trouverez ci-dessous un graphique ggpairs obtenu à partir d'un échantillon normal trivarié avec n = 1000.
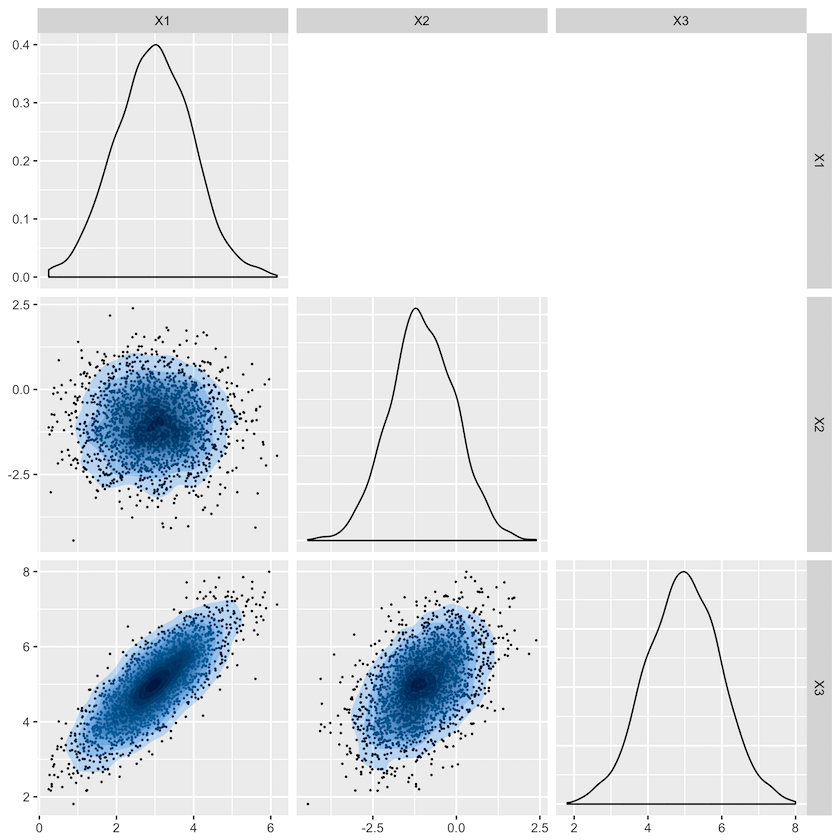
Quelle est la paire la plus probable de mu et sigma ayant généré cet échantillon ?
$$\mbox{(a)}\quad \mu= \begin{pmatrix} 3 \\ 1 \\ 2 \end{pmatrix}, \Sigma={\begin{pmatrix} 1 & 0.6 & 0.4 \\ 0.6 & 1 & 0.5 \\ 0.4 & 0.5 & 1 \end{pmatrix}}$$
$$ \mbox{(b)} \quad\mu= \begin{pmatrix} 3 \\ 1 \\ 2 \end{pmatrix}, \Sigma={\begin{pmatrix} 1 & 0 & 0.8 \\ 0 & 1 & 0.5 \\ 0.8 & 0.5 & 1 \end{pmatrix}}$$
$$\mbox{(c)} \quad\mu= \begin{pmatrix} 3 \\ -1 \\ 5 \end{pmatrix}, \Sigma={\begin{pmatrix} 1 & 0.6 & 0.4 \\ 0.6 & 1 & 0.5 \\ 0.4 & 0.5 & 1 \end{pmatrix}}$$
$$\mbox{(d)} \quad \mu= \begin{pmatrix} 3 \\ -1 \\ 5 \end{pmatrix}, \Sigma={\begin{pmatrix} 1 & 0 & 0.8 \\ 0 & 1 & 0.5 \\ 0.8 & 0.5 & 1 \end{pmatrix}}$$
Cette activité fait partie du cours
Lois de probabilité multivariée en R
Exercice interactif pratique
Passez de la théorie à l’action grâce à l’un de nos exercices interactifs
 Commencer l’exercice