Identifica la distribución de una muestra normal
A continuación verás un gráfico ggpairs de una muestra normal trivariante con n = 1000.
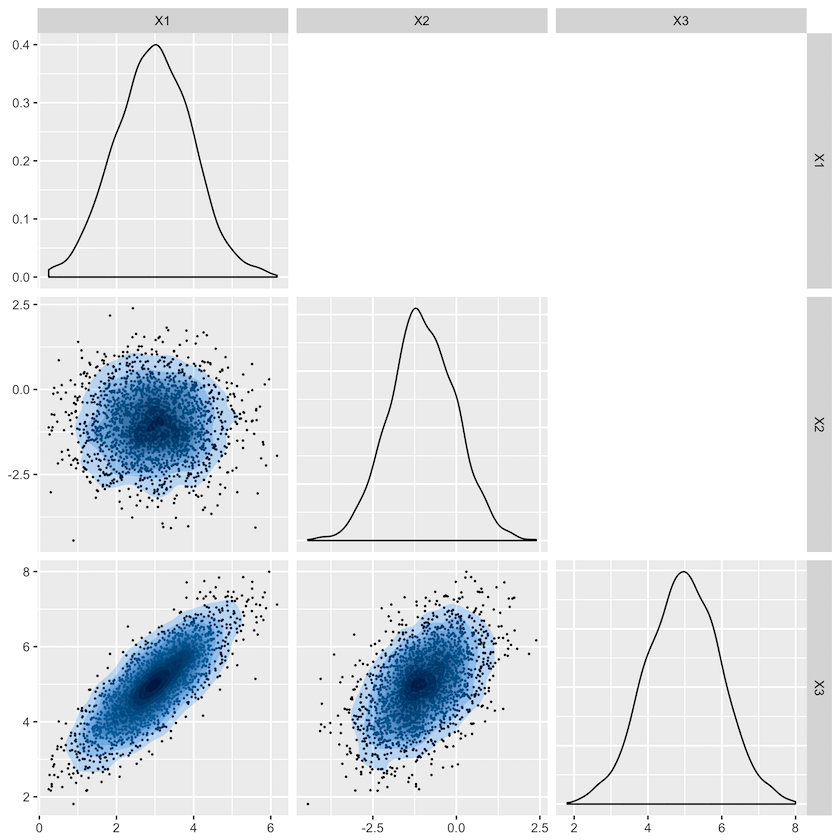
¿Cuál es el par más probable de mu y sigma que generó esta muestra?
$$\mbox{(a)}\quad \mu= \begin{pmatrix} 3 \\ 1 \\ 2 \end{pmatrix}, \Sigma={\begin{pmatrix} 1 & 0.6 & 0.4 \\ 0.6 & 1 & 0.5 \\ 0.4 & 0.5 & 1 \end{pmatrix}}$$
$$ \mbox{(b)} \quad\mu= \begin{pmatrix} 3 \\ 1 \\ 2 \end{pmatrix}, \Sigma={\begin{pmatrix} 1 & 0 & 0.8 \\ 0 & 1 & 0.5 \\ 0.8 & 0.5 & 1 \end{pmatrix}}$$
$$\mbox{(c)} \quad\mu= \begin{pmatrix} 3 \\ -1 \\ 5 \end{pmatrix}, \Sigma={\begin{pmatrix} 1 & 0.6 & 0.4 \\ 0.6 & 1 & 0.5 \\ 0.4 & 0.5 & 1 \end{pmatrix}}$$
$$\mbox{(d)} \quad \mu= \begin{pmatrix} 3 \\ -1 \\ 5 \end{pmatrix}, \Sigma={\begin{pmatrix} 1 & 0 & 0.8 \\ 0 & 1 & 0.5 \\ 0.8 & 0.5 & 1 \end{pmatrix}}$$
Este ejercicio forma parte del curso
Distribuciones de probabilidad multivariantes en R
ejercicio interactivo práctico
Convierte la teoría en práctica con uno de nuestros ejercicios interactivos
 Empezar ejercicio