Ergebnisse interpretieren
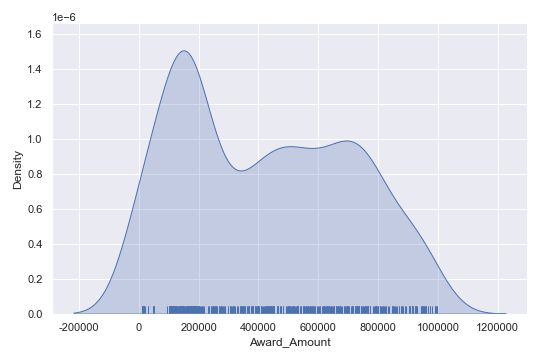
Wenn du dir dieses displot ansiehst: Welche dieser Aussagen kannst du anhand der Visualisierung ableiten?
Diese Übung ist Teil des Kurses
<Kurs>Fortgeschrittene Datenvisualisierung mit Seaborn</Kurs>Interaktive praktische Übung
Verwandle Theorie mit einer unserer interaktiven Übungen in die Praxis
 Übung starten