stripplot() und swarmplot()
Viele Datensätze enthalten kategoriale Daten, und Seaborn unterstützt dafür mehrere hilfreiche Diagrammtypen. In diesem Beispiel betrachten wir weiterhin die Daten zur Schulverbesserung von 2010 und segmentieren die Daten nach den verwendeten Schulverbesserungsmodellen.
Zur Auffrischung hier die KDE-Verteilung der Award-Beträge:
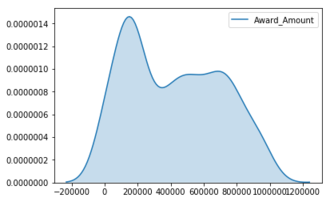
Dieses Diagramm ist hilfreich, aber wir können noch mehr lernen, wenn wir uns die einzelnen Award_Amount ansehen und wie sich die Beträge auf die vier Kategorien verteilen.
Diese Übung ist Teil des Kurses
<Kurs>Fortgeschrittene Datenvisualisierung mit Seaborn</Kurs>Interaktive praktische Übung
Versuche dich an dieser Übung, indem du diesen Beispielcode vervollständigst.
# Create the stripplot
sns.____(data=df,
         x='____',
         y='____',
         jitter=____)

plt.show()