Interpretar gráficos de autocorrelação parcial
Se os valores de autocorrelação parcial estão próximos de 0, então os valores entre observações e observações defasadas não são correlacionados entre si. Por outro lado, autocorrelações parciais com valores próximos de 1 ou -1 indicam que existem fortes correlações positivas ou negativas entre as observações defasadas da série temporal.
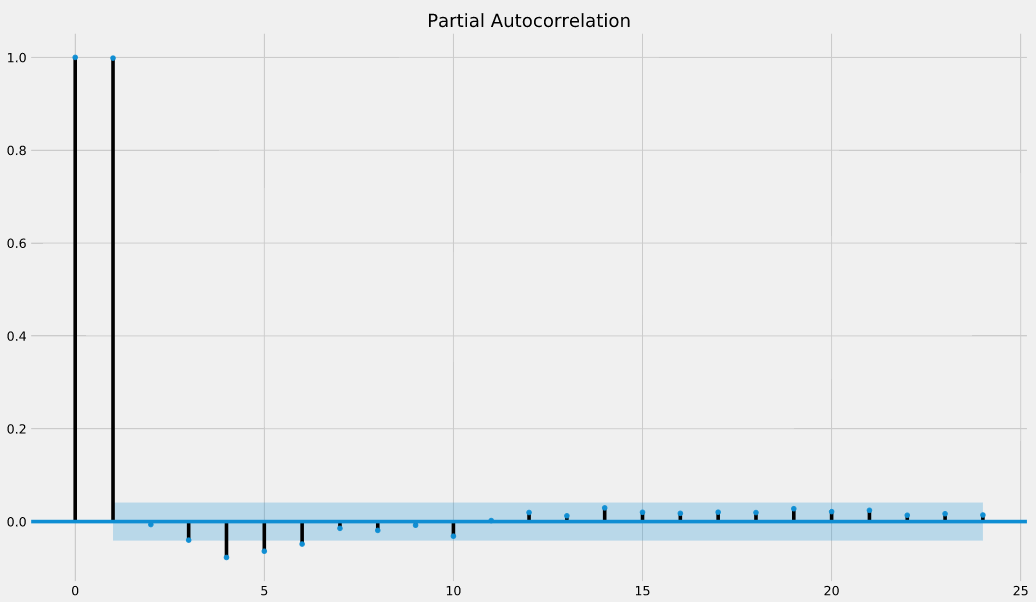
A função .plot_pacf() também retorna intervalos de confiança, que são representados como regiões sombreadas em azul. Se os valores de autocorrelação parcial estiverem fora dessas regiões de intervalo de confiança, você pode assumir que os valores observados de autocorrelação parcial são estatisticamente significativos.
No gráfico de autocorrelação parcial abaixo, em quais valores de defasagem temos autocorrelações parciais estatisticamente significativas?
Este exercicio faz parte do curso
Visualizing Time Series Data in Python
exercicio interativo prático
Transforme teoria em prática com um dos nossos exercicio interativos
 Iniciar exercicio