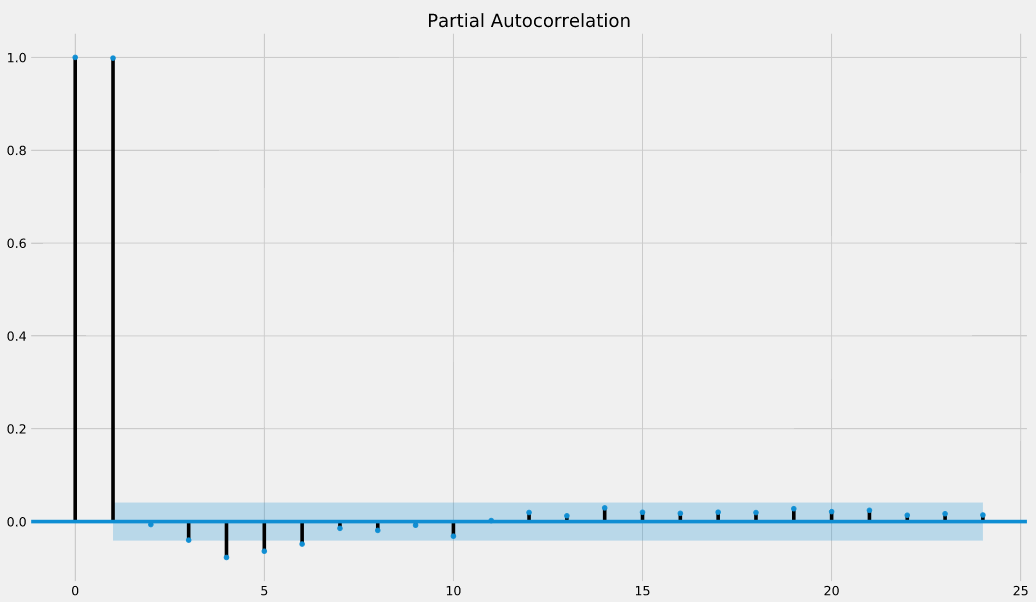
Partiële autocorrelatieplots interpreteren
Als partiële autocorrelatiewaarden dicht bij 0 liggen, dan zijn waarden tussen waarnemingen en vertraagde waarnemingen niet met elkaar gecorreleerd. Omgekeerd duiden partiële autocorrelaties met waarden dicht bij 1 of -1 op een sterke positieve of negatieve correlatie tussen de vertraagde waarnemingen van de tijdreeks.
De functie .plot_pacf() geeft ook betrouwbaarheidsintervallen terug, weergegeven als blauw gearceerde gebieden. Als partiële autocorrelatiewaarden buiten deze betrouwbaarheidsintervallen vallen, mag je aannemen dat de geobserveerde partiële autocorrelatiewaarden statistisch significant zijn.
In de partiële autocorrelatieplot hieronder: bij welke lag-waarden zien we statistisch significante partiële autocorrelaties?
Deze oefening maakt deel uit van de cursus
Tijdreeksen visualiseren in Python
Interactieve oefening met praktijkervaring
Zet theorie om in actie met een van onze interactieve oefeningen
 Begin oefening