Correlaties interpreteren
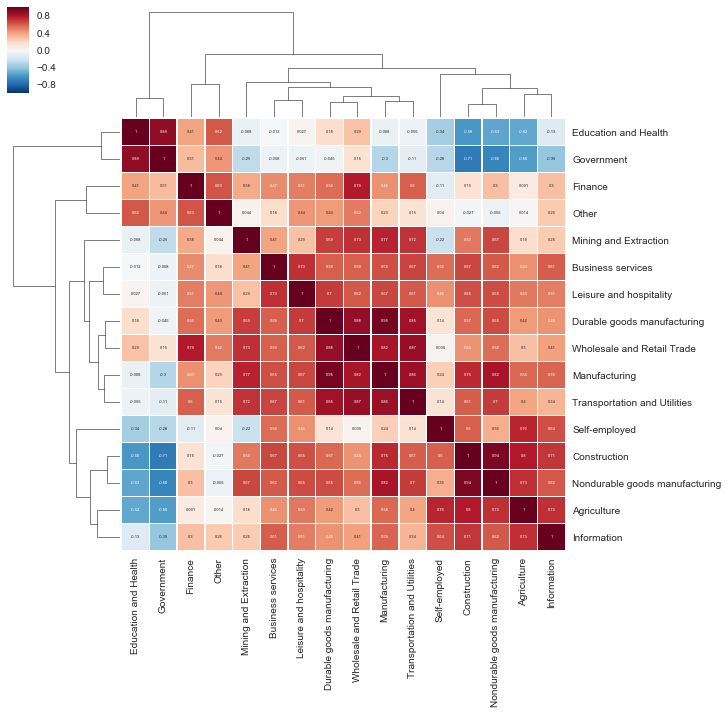
De tijdreeksen in de jobs-DataFrame bevatten meerdere tijdreeksen met heel verschillende seizoenspatronen. Gebruik de clustermap van de correlatieplots die je in de vorige oefening hebt gemaakt: kun je bepalen en toelichten welke tijdreeks het sterkst correleert met de baancategorie Self-Employed?
Deze oefening maakt deel uit van de cursus
Tijdreeksen visualiseren in Python
Interactieve oefening met praktijkervaring
Zet theorie om in actie met een van onze interactieve oefeningen
 Begin oefening