Regressione logistica non lineare
Nel capitolo 3 hai esplorato la distanza percorsa dai pendolari e l’effetto lineare che questa aveva sulla probabilità che qualcuno prendesse l’autobus. Ma cosa succede se questa relazione è non lineare e non monotona?
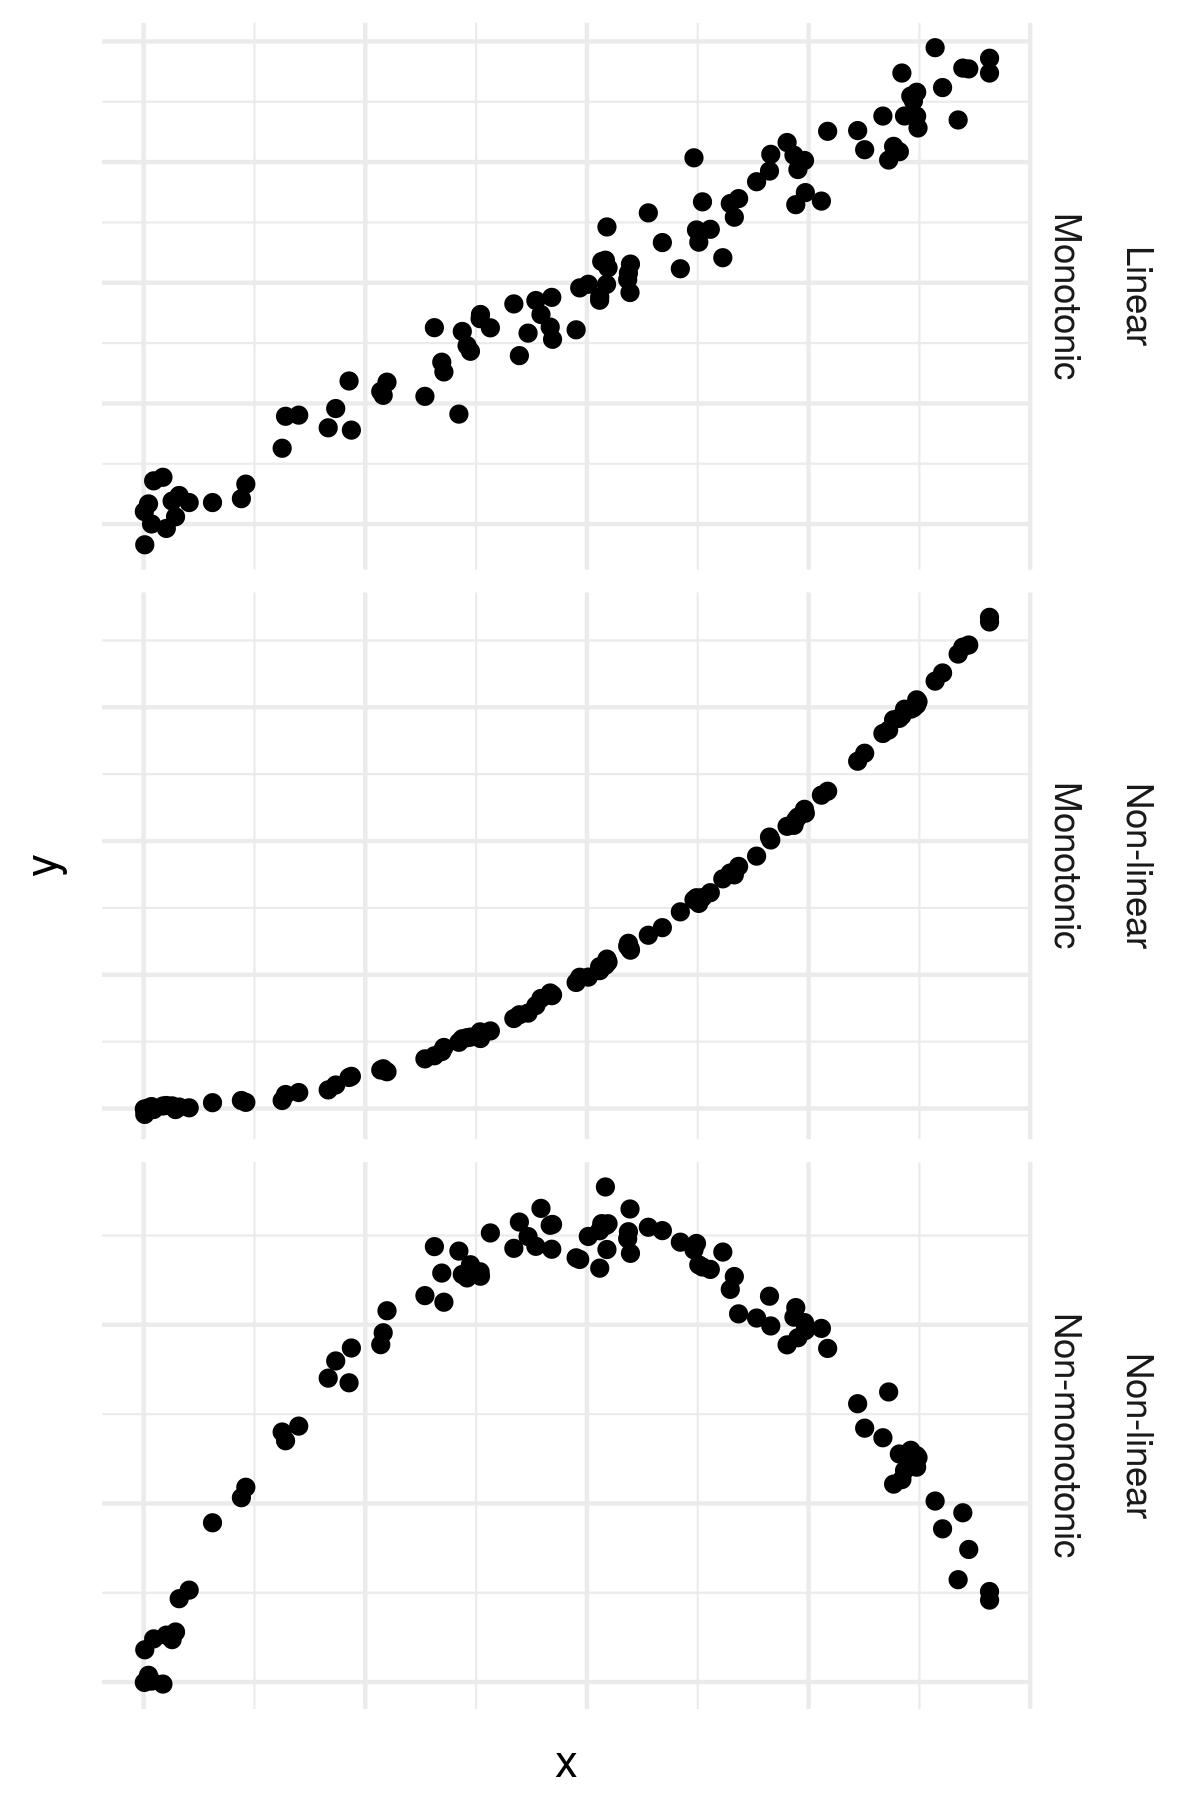
Per esempio, e se chi percorre le distanze più brevi e quelle più lunghe fosse meno propenso a usare l’autobus?
Puoi aggiungere termini non lineari alle formule in R usando la funzione I(..) all’interno della formula.
Per esempio, y~I(x^2) ti permette di stimare un coefficiente per x*x.
In questo esercizio analizzerai più a fondo i dati sull’autobus.
Questo esercizio fa parte del corso
Generalized Linear Models in R
Istruzioni dell'esercizio
- Aggiungi la formula
y ~ I(x^2)all’opzioneformulanella seconda chiamata ageom_smooth().
esercizio interattivo pratico
Prova questo esercizio completando questo codice di esempio.
# Plot linear effect of travel distance on probability of taking the bus
gg_jitter <-
	ggplot(data = bus, aes(x = MilesOneWay, y = Bus2)) +
	geom_jitter(width = 0, height = 0.05) +
	geom_smooth(method = 'glm',
                method.args = list(family = 'binomial'))

# Add a non-linear equation to a geom_smooth()
gg_jitter +
	geom_smooth(method = 'glm',
                method.args = list(family = 'binomial'),
                formula = ___,
                color = 'red')