Régression logistique non linéaire
Au chapitre 3, vous avez étudié la distance parcourue par les personnes en trajet domicile-travail et l’effet linéaire de cette distance sur la probabilité de prendre le bus. Mais que se passe-t-il si cette relation est non linéaire et non monotone ?
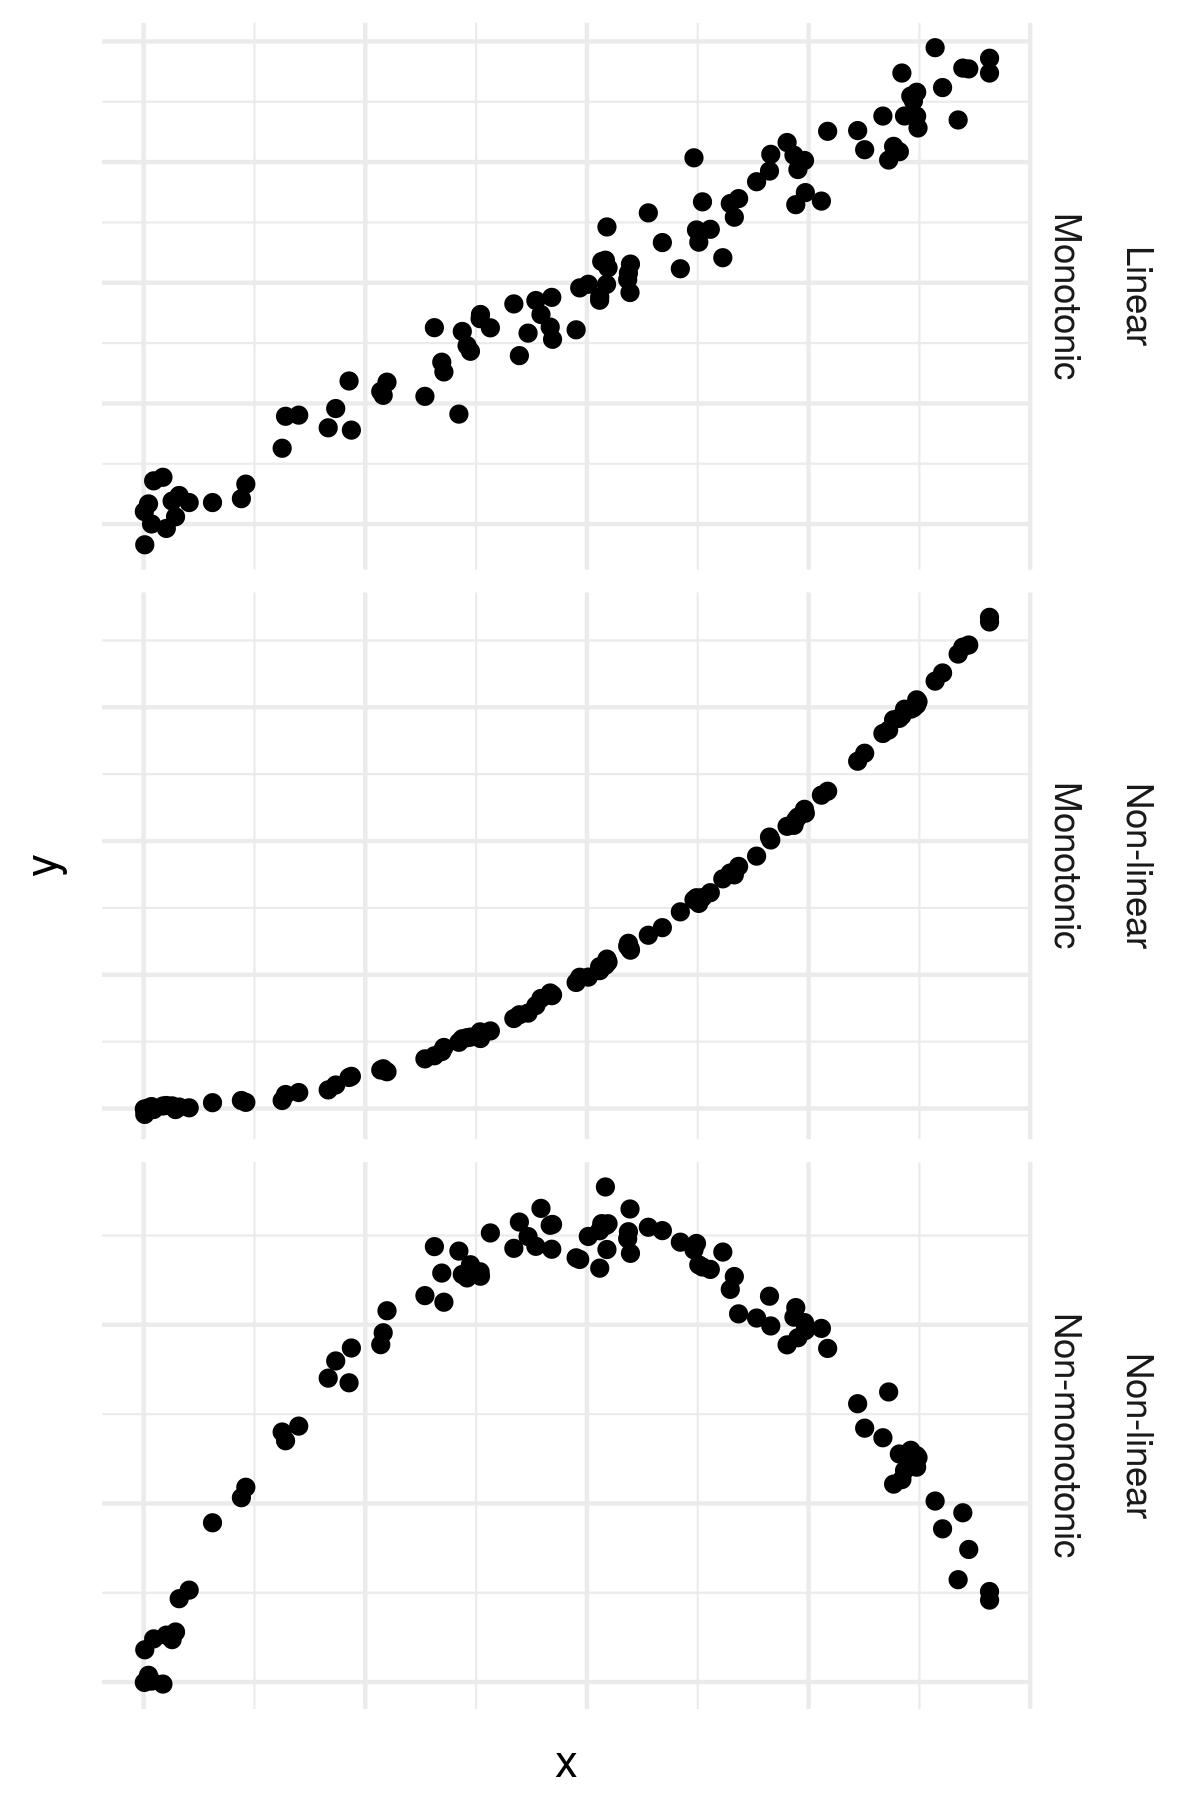
Par exemple, et si les personnes qui ont les trajets les plus courts et les plus longs étaient moins susceptibles de prendre le bus ?
Vous pouvez ajouter des termes non linéaires aux formules en R à l’aide de la fonction I(..) dans la formule.
Par exemple, y~I(x^2) vous permet d’estimer un coefficient pour x*x.
Dans cet exercice, vous allez examiner plus en détail les données sur le bus.
Cet exercice fait partie du cours
<cours>Modèles Linéaires Généralisés (GLM) en R</cours>Instructions de l’exercice
- Ajoutez la formule
y ~ I(x^2)à l’optionformuladans le deuxième appel àgeom_smooth().
Exercice interactif pratique
Essayez cet exercice en complétant ce code d’exemple.
# Plot linear effect of travel distance on probability of taking the bus
gg_jitter <-
	ggplot(data = bus, aes(x = MilesOneWay, y = Bus2)) +
	geom_jitter(width = 0, height = 0.05) +
	geom_smooth(method = 'glm',
                method.args = list(family = 'binomial'))

# Add a non-linear equation to a geom_smooth()
gg_jitter +
	geom_smooth(method = 'glm',
                method.args = list(family = 'binomial'),
                formula = ___,
                color = 'red')