探索 2014 年科技業心理健康調查
別被嚇到,這題你將一次把整個應用程式(不含自訂錯誤訊息)都做出來!
在這個應用程式中,你會把「你認為和雇主討論心理健康問題,會帶來負面影響嗎?」(變數 mental_health_consequence)與「你覺得你的雇主對心理健康的重視程度,和對身體健康一樣嗎?」(mental_vs_physical)設為可多選的輸入,接著顯示受訪者 Age 的長條圖。若要查看這些變數可選項目,請在主控台用 count() 查看。
回想一下,完成後的應用程式會長這樣(包含空白的圖):
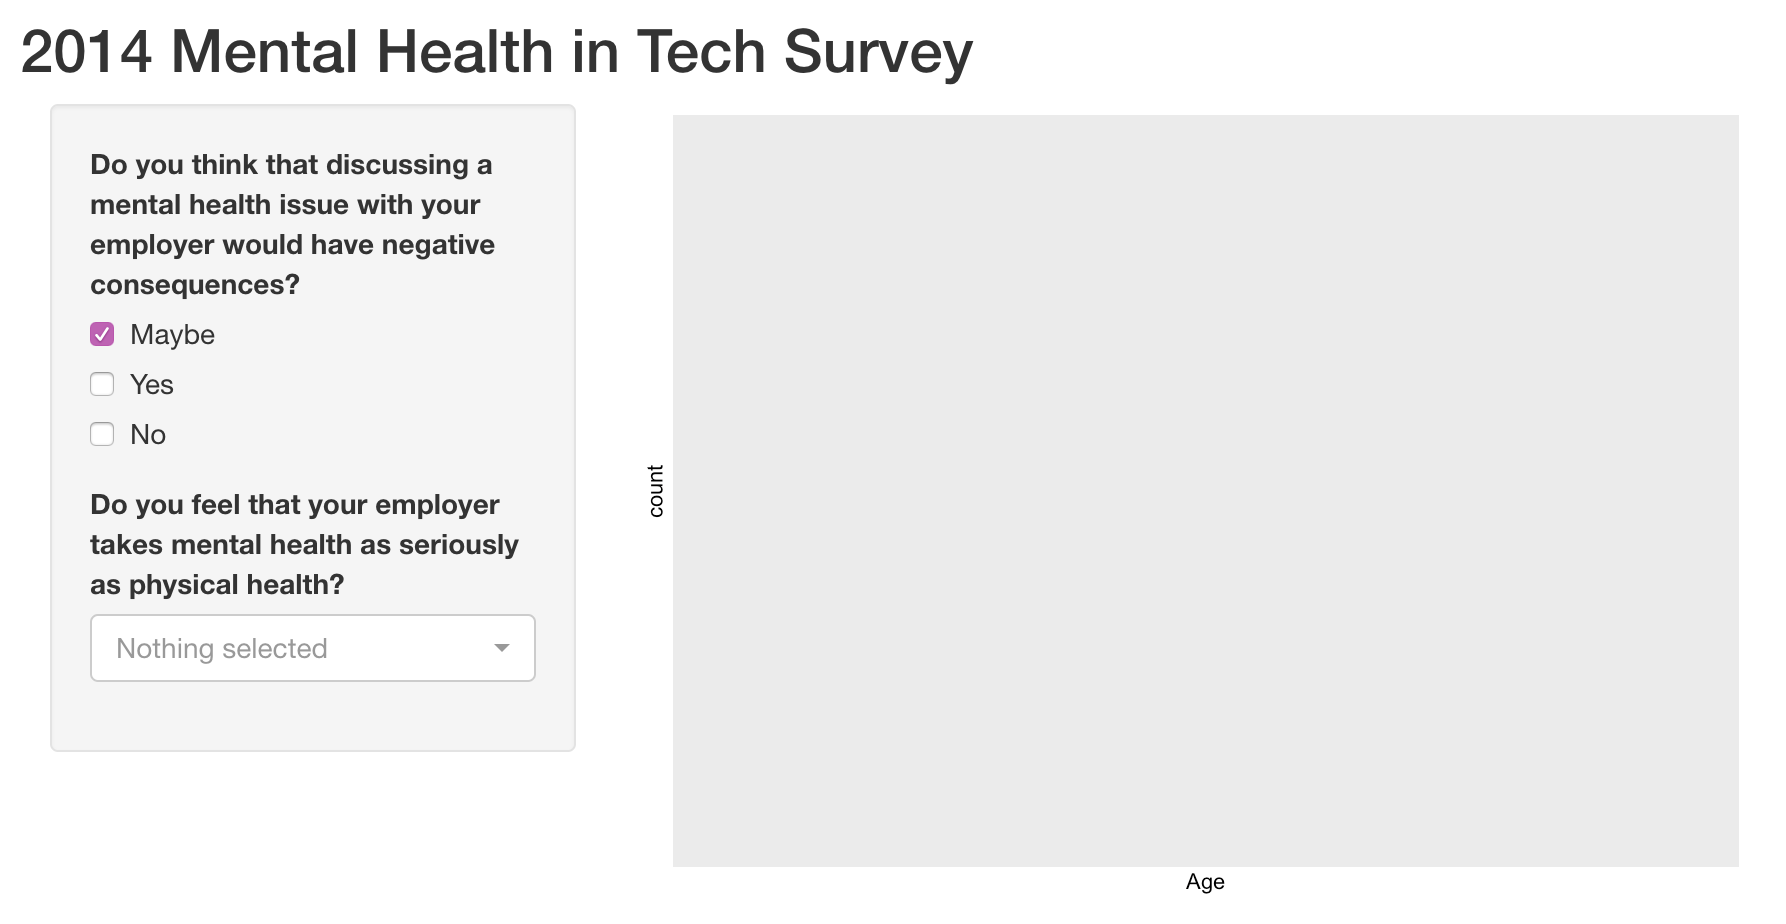
shiny、ggplot2、dplyr,以及 mental_health_survey 資料集都已為你載入。
本練習屬於課程
使用 R 的 Shiny 建立網頁應用程式
練習說明
- UI:
- 為應用程式加入合適的標題。
- 新增一個
checkboxGroupInput()。在selected參數中包含一個預設值。 - 新增一個
pickerInput(),並將multiple參數設為TRUE。 - 在主面板加入一個
plotOutput()。
- Server:
- 新增一個輸出,先依兩個輸入篩選資料後,顯示受訪者
Age的長條圖。
- 新增一個輸出,先依兩個輸入篩選資料後,顯示受訪者
動手互動練習
試著完成這個範例程式碼,體驗一下這個練習。
ui <- fluidPage(
  # CODE BELOW: Add an appropriate title

  sidebarPanel(
  	# CODE BELOW: Add a checkboxGroupInput


  	# CODE BELOW: Add a pickerInput


  ),
  mainPanel(
	# CODE BELOW: Display the output

  )
)

server <- function(input, output, session) {
  # CODE BELOW: Build a histogram of the age of respondents
  # Filtered by the two inputs


}

shinyApp(ui, server)