大規模槍擊事件:修改輸出
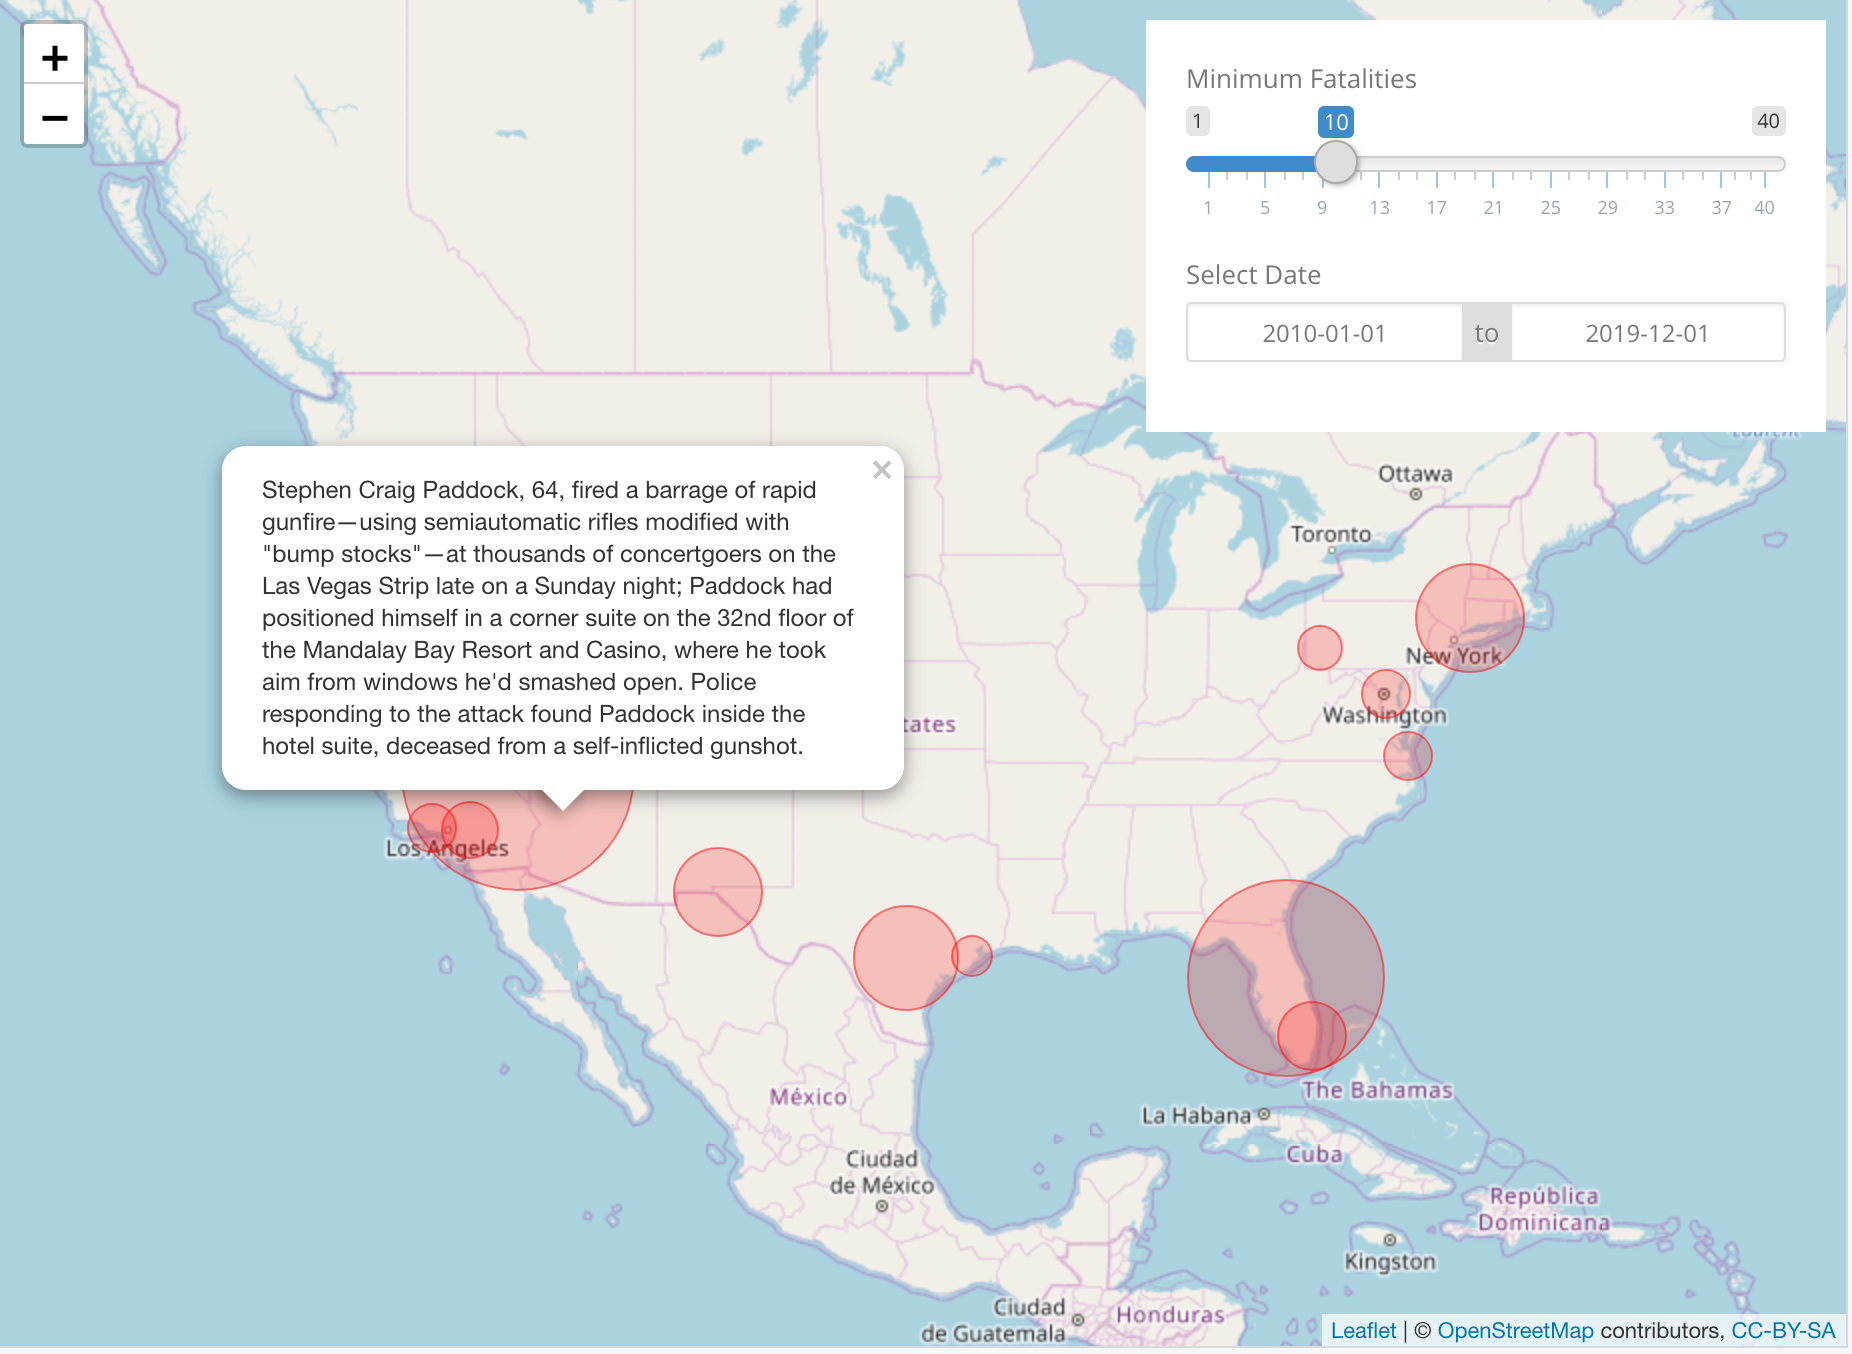
在這個練習中,你要延伸先前建立的 Shiny 應用。讓互動地圖上出現以死亡人數決定大小的紅色圓點,並在點擊圓點時顯示該案件的摘要。完成後的應用會長得像這張螢幕截圖。
本練習屬於課程
使用 R 的 Shiny 建立網頁應用程式
練習說明
- 更新反應式運算
rval_mass_shootings,讓資料集依使用者選取的死亡人數(nb_fatalities)與日期範圍(date_range)進行篩選。 - 更新
addCircleMarkers()中的程式碼,將圓點的radius對應到fatalities,並將popup參數對應到summary。請注意,可以用p = ~ f的語法,將參數p對應到欄位f。
動手互動練習
試著完成這個範例程式碼,體驗一下這個練習。
ui <- bootstrapPage(
  theme = shinythemes::shinytheme('simplex'),
  leaflet::leafletOutput('map', height = '100%', width = '100%'),
  absolutePanel(top = 10, right = 10, id = 'controls',
    sliderInput('nb_fatalities', 'Minimum Fatalities', 1, 40, 10),
    dateRangeInput('date_range', 'Select Date', "2010-01-01", "2019-12-01")
  ),
  tags$style(type = "text/css", "
    html, body {width:100%;height:100%}
    #controls{background-color:white;padding:20px;}
  ")
)

server <- function(input, output, session) {
  rval_mass_shootings <- reactive({
    # MODIFY CODE BELOW: Filter mass_shootings on nb_fatalities and
    # selected date_range.
    mass_shootings


  })
  output$map <- leaflet::renderLeaflet({
    rval_mass_shootings() %>%
      leaflet() %>%
      addTiles() %>%
      setView( -98.58, 39.82, zoom = 5) %>%
      addTiles() %>%
      addCircleMarkers(
        # CODE BELOW: Add parameters popup and radius and map them
        # to the summary and fatalities columns

        fillColor = 'red', color = 'red', weight = 1
      )
  })
}

shinyApp(ui, server)