探索各菜系:熱門食材
美食具有普遍吸引力,由於食材多元,能夠搭配出幾乎無窮無盡的料理!在本練習中,你會使用名為 recipes 的資料集,其中包含食譜、所屬菜系,以及使用到的食材,來建立一個 Shiny 應用,讓使用者依菜系探索最常用的食材。
你的最終應用應該與螢幕截圖中的畫面相似。
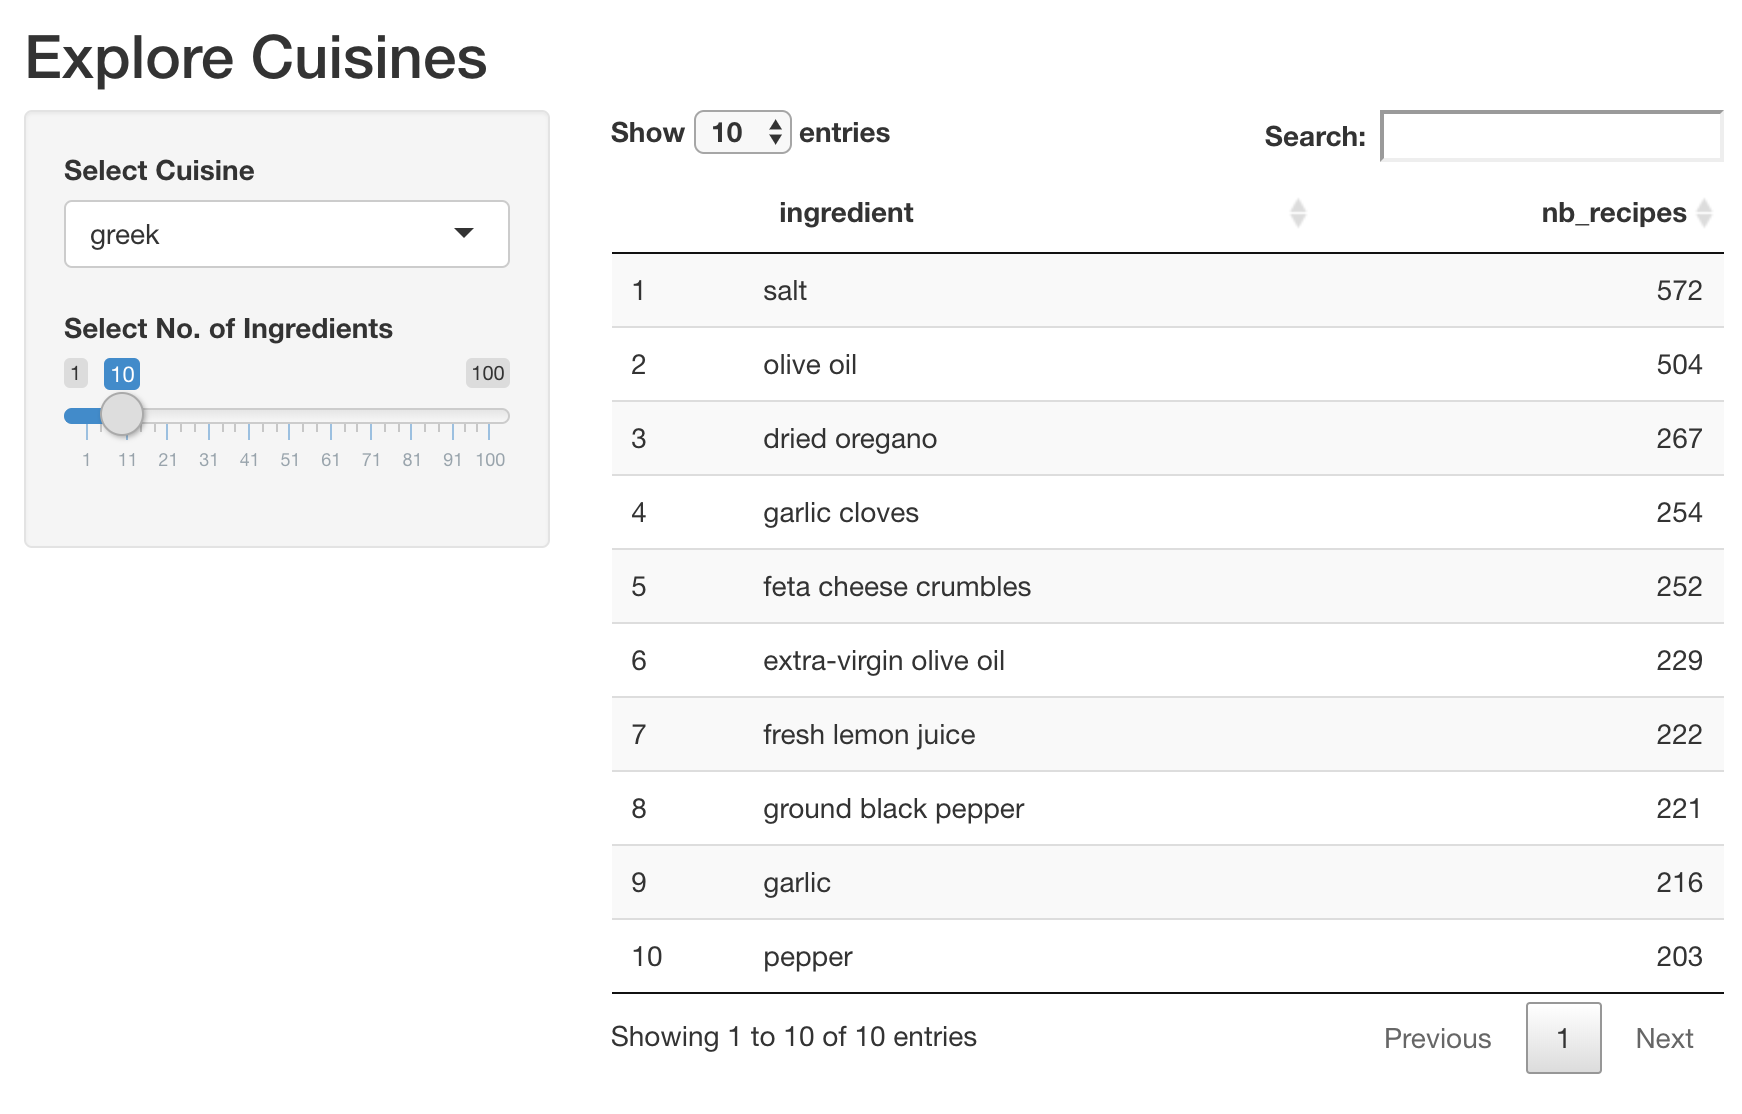
我們已經載入 shiny 與 dplyr 套件,以及 recipes 資料集。另有一段方便的程式碼可以取得希臘菜系中最常用的前 10 種食材。你可以據此,依使用者選取的菜系與顯示的食材數量,在應用中建立互動式資料表。
recipes %>%
  filter(cuisine == 'greek') %>%
  count(ingredient, name = 'nb_recipes') %>%
  arrange(desc(nb_recipes)) %>%
  head(10)
本練習屬於課程
使用 R 的 Shiny 建立網頁應用程式
練習說明
- UI:
- 在側邊欄新增名為
cuisine的輸入元件,讓使用者從recipes資料集中所有可用的菜系中選擇其一。 - 在側邊欄新增名為
nb_ingredients的滑桿輸入,讓使用者選擇要顯示的食材數量。 - 在主面板新增名為
dt_top_ingredients的互動式資料表輸出。
- 在側邊欄新增名為
- Server:
- 依使用者選取的菜系與要顯示的熱門食材數量來篩選
recipes。 - 將篩選後的資料渲染為互動式資料表。
- 指派到名為
dt_top_ingredients的輸出物件。
- 依使用者選取的菜系與要顯示的熱門食材數量來篩選
動手互動練習
試著完成這個範例程式碼,體驗一下這個練習。
ui <- fluidPage(
  titlePanel('Explore Cuisines'),
  sidebarLayout(
    sidebarPanel(
      # CODE BELOW: Add an input named "cuisine" to select a cuisine

      # CODE BELOW: Add an input named "nb_ingredients" to select # of ingredients

    ),
    mainPanel(
      # CODE BELOW: Add a DT output named "dt_top_ingredients"

    )
  )
)

server <- function(input, output, session) {
  # CODE BELOW: Render the top ingredients in a chosen cuisine as
  # an interactive data table and assign it to output object `dt_top_ingredients`


}

shinyApp(ui, server)