Interpretando gráficos de séries temporais
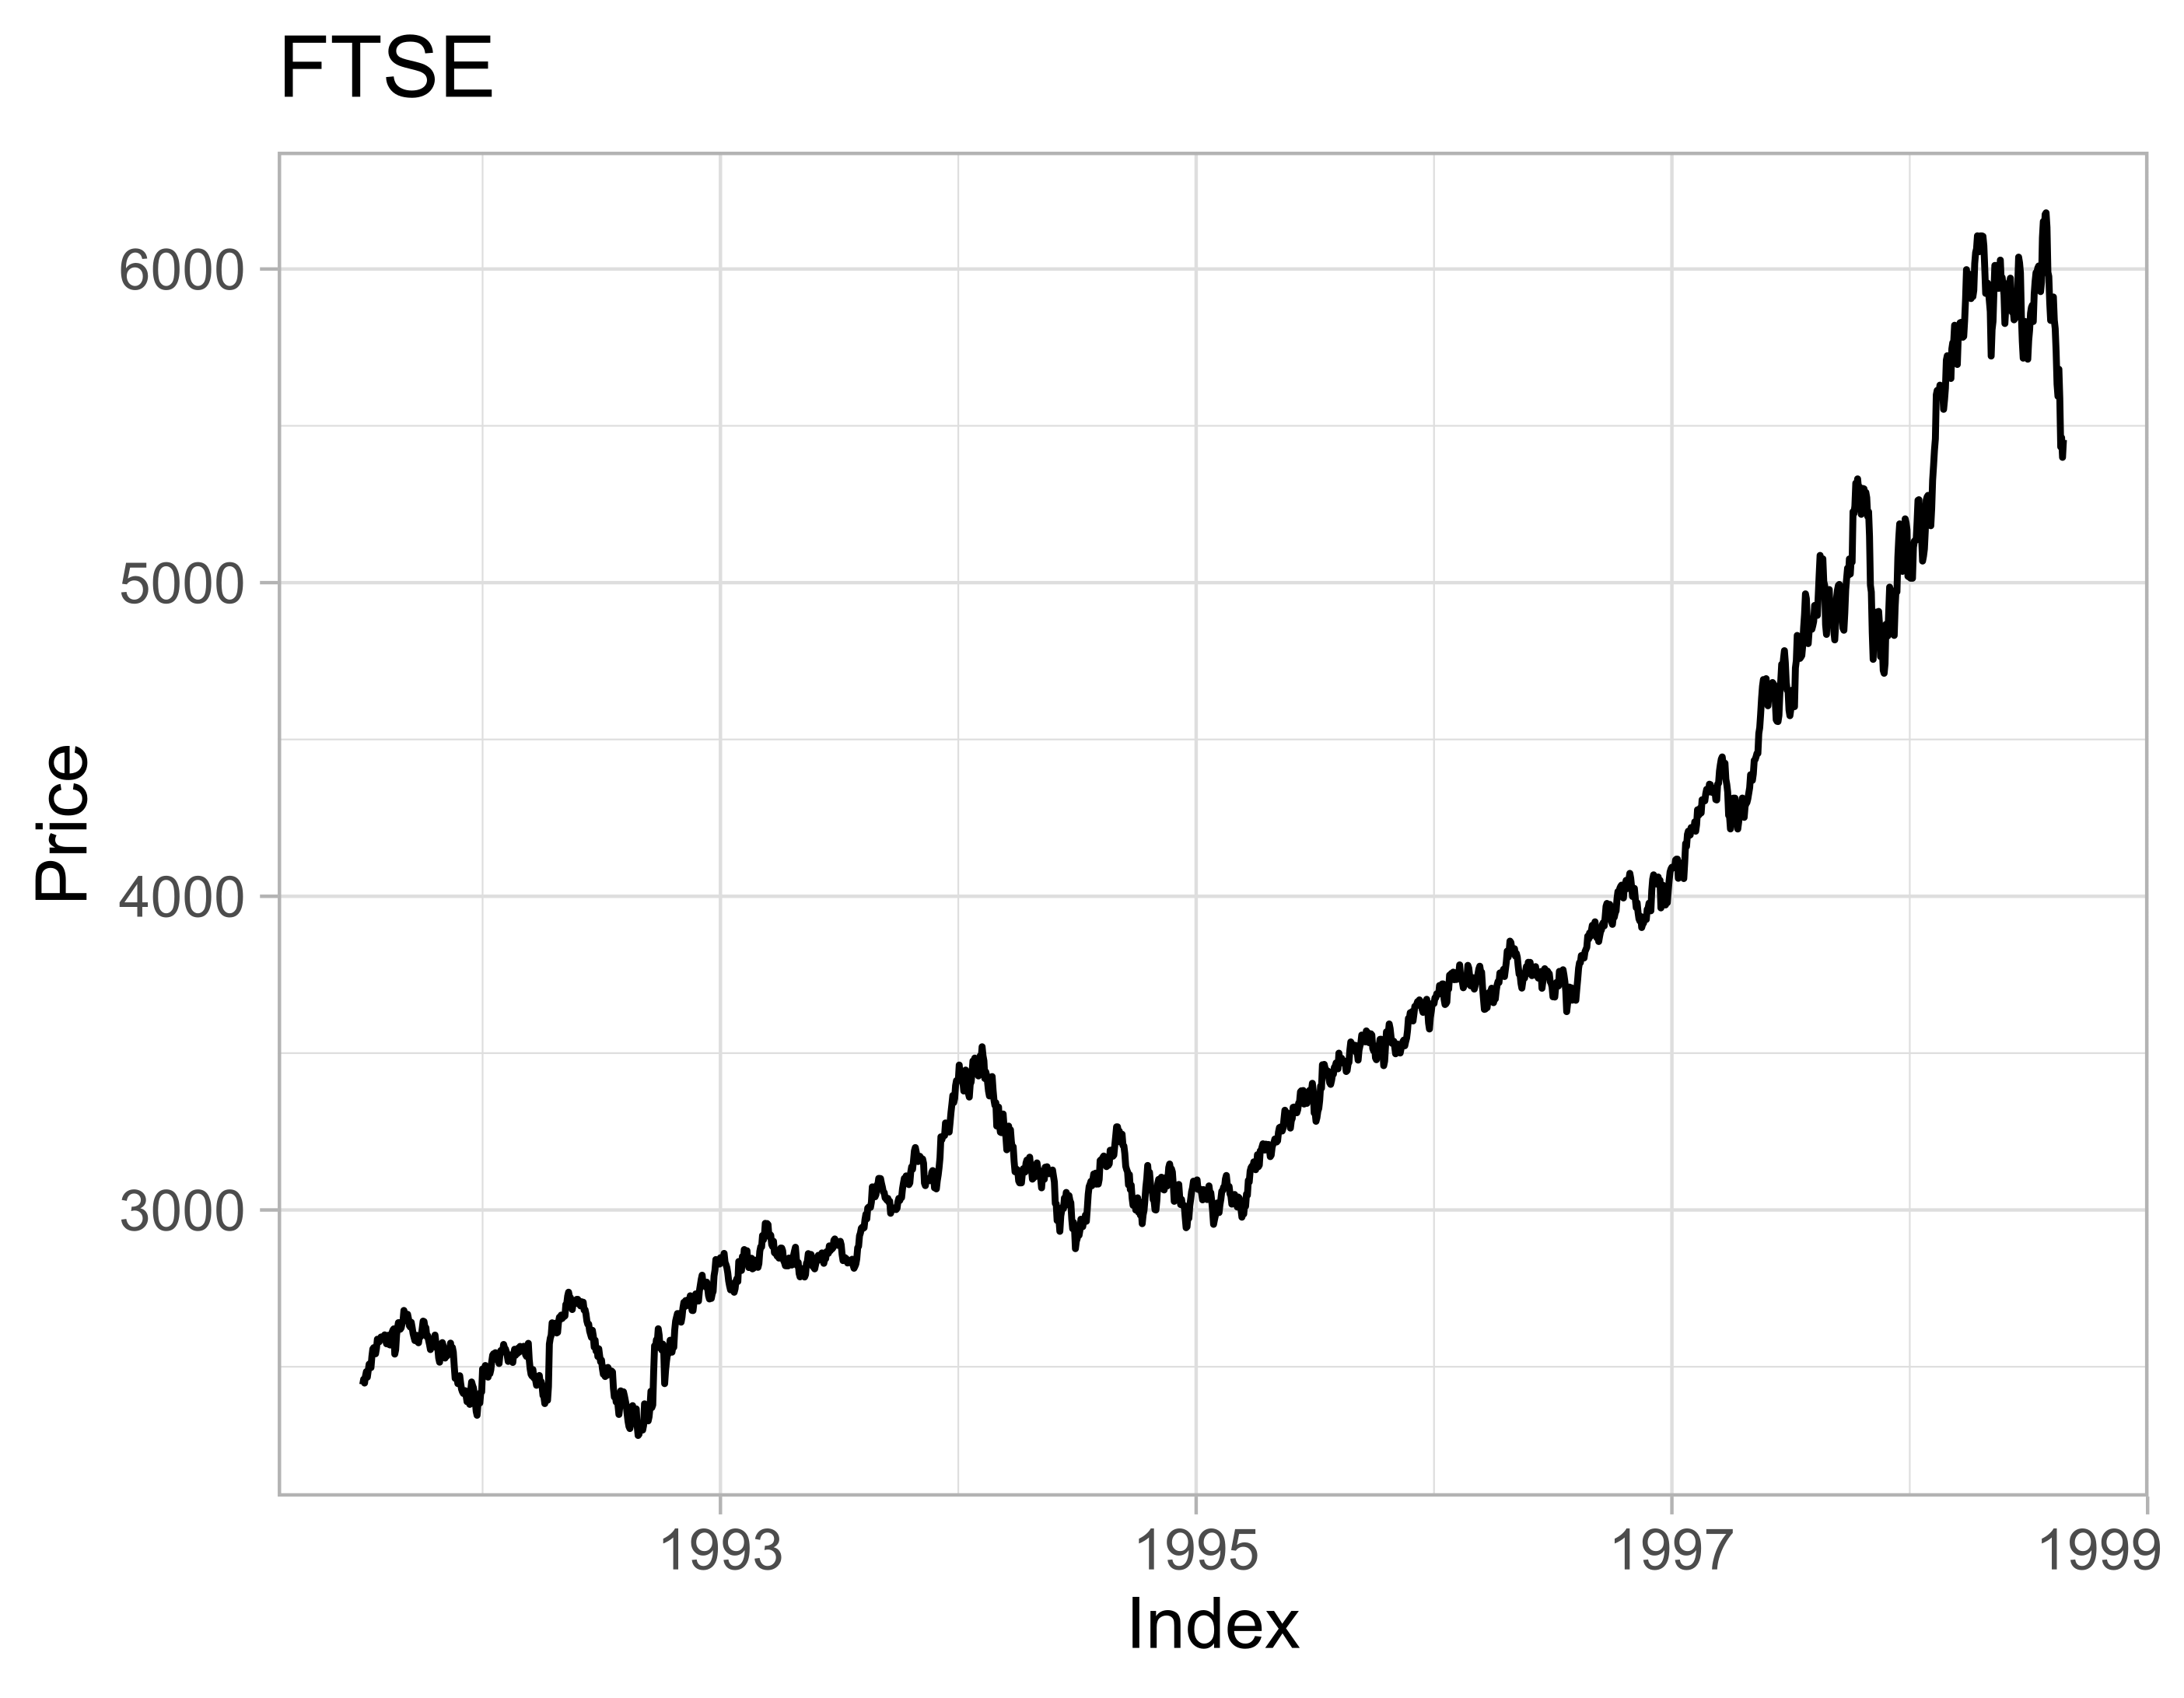
Ao visualizar dados de séries temporais, é essencial saber interpretar os diferentes recursos e atributos dos gráficos dos seus dados. Determinar as propriedades dos seus dados a partir de um gráfico ajuda você a preparar melhor as ferramentas necessárias para a análise. Neste exercício, você vai interpretar algumas das propriedades da série temporal ftse, com base no seu gráfico.
Este exercicio faz parte do curso
Manipulando Dados de Séries Temporais em R
exercicio interativo prático
Transforme teoria em prática com um dos nossos exercicio interativos
 Iniciar exercicio