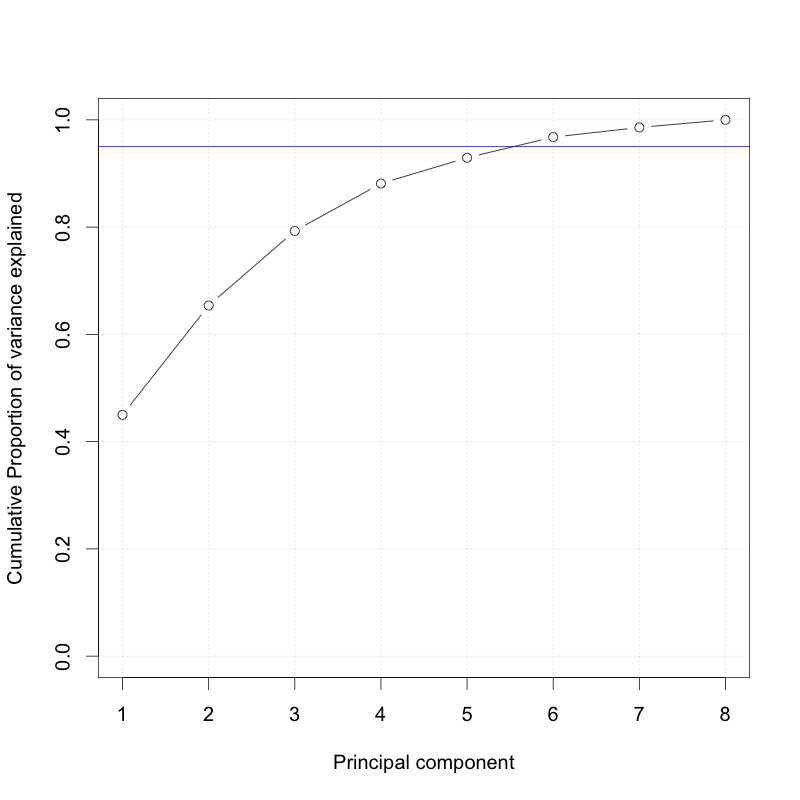
Aantal componenten dat 95% van de variatie verklaart
Op basis van de grafiek uit de vorige oefening, hieronder weergegeven, hoeveel componenten zijn er nodig om 95% van de variatie in de data te verklaren?
Deze oefening maakt deel uit van de cursus
Multivariate kansverdelingen in R
Interactieve oefening met praktijkervaring
Zet theorie om in actie met een van onze interactieve oefeningen
 Begin oefening